Convective windstorms in 2017 Episode 2: 17 September

The event with the second highest societal impact after the Moscow windstorm, occurred on 17 September in a swath from Bosnia and Herzegovina to Ukraine. It was also the last severe convective windstorm case of 2017. The date is actually well after the climatological peak of severe storm activity in the area, which is in June and July.

The event started with a cluster of thunderstorms impacting Split, Croatia, in the morning hours. This activity produced very large hail up to 5 cm in diameter that resulted in damage to cars. The first severe wind gusts were reported from Bosnia and Herzegovina and the convective system reached its peak intensity as it raced across northern Serbia and southern Ukraine between 11 and 16 UTC (Fig. 1), with measured wind gusts reaching up to 35 m/s. Widespread damage was reported, roofs were torn off of buildings, powerlines snapped and trees uprooted. The last severe wind gust reports were received from around 17 UTC over Ukraine. Overall, the system killed 10 and injured 94 along its track. Some of the damage suggests that much stronger wind speeds, than the measured maximum of 35 m/s, must have been involved.

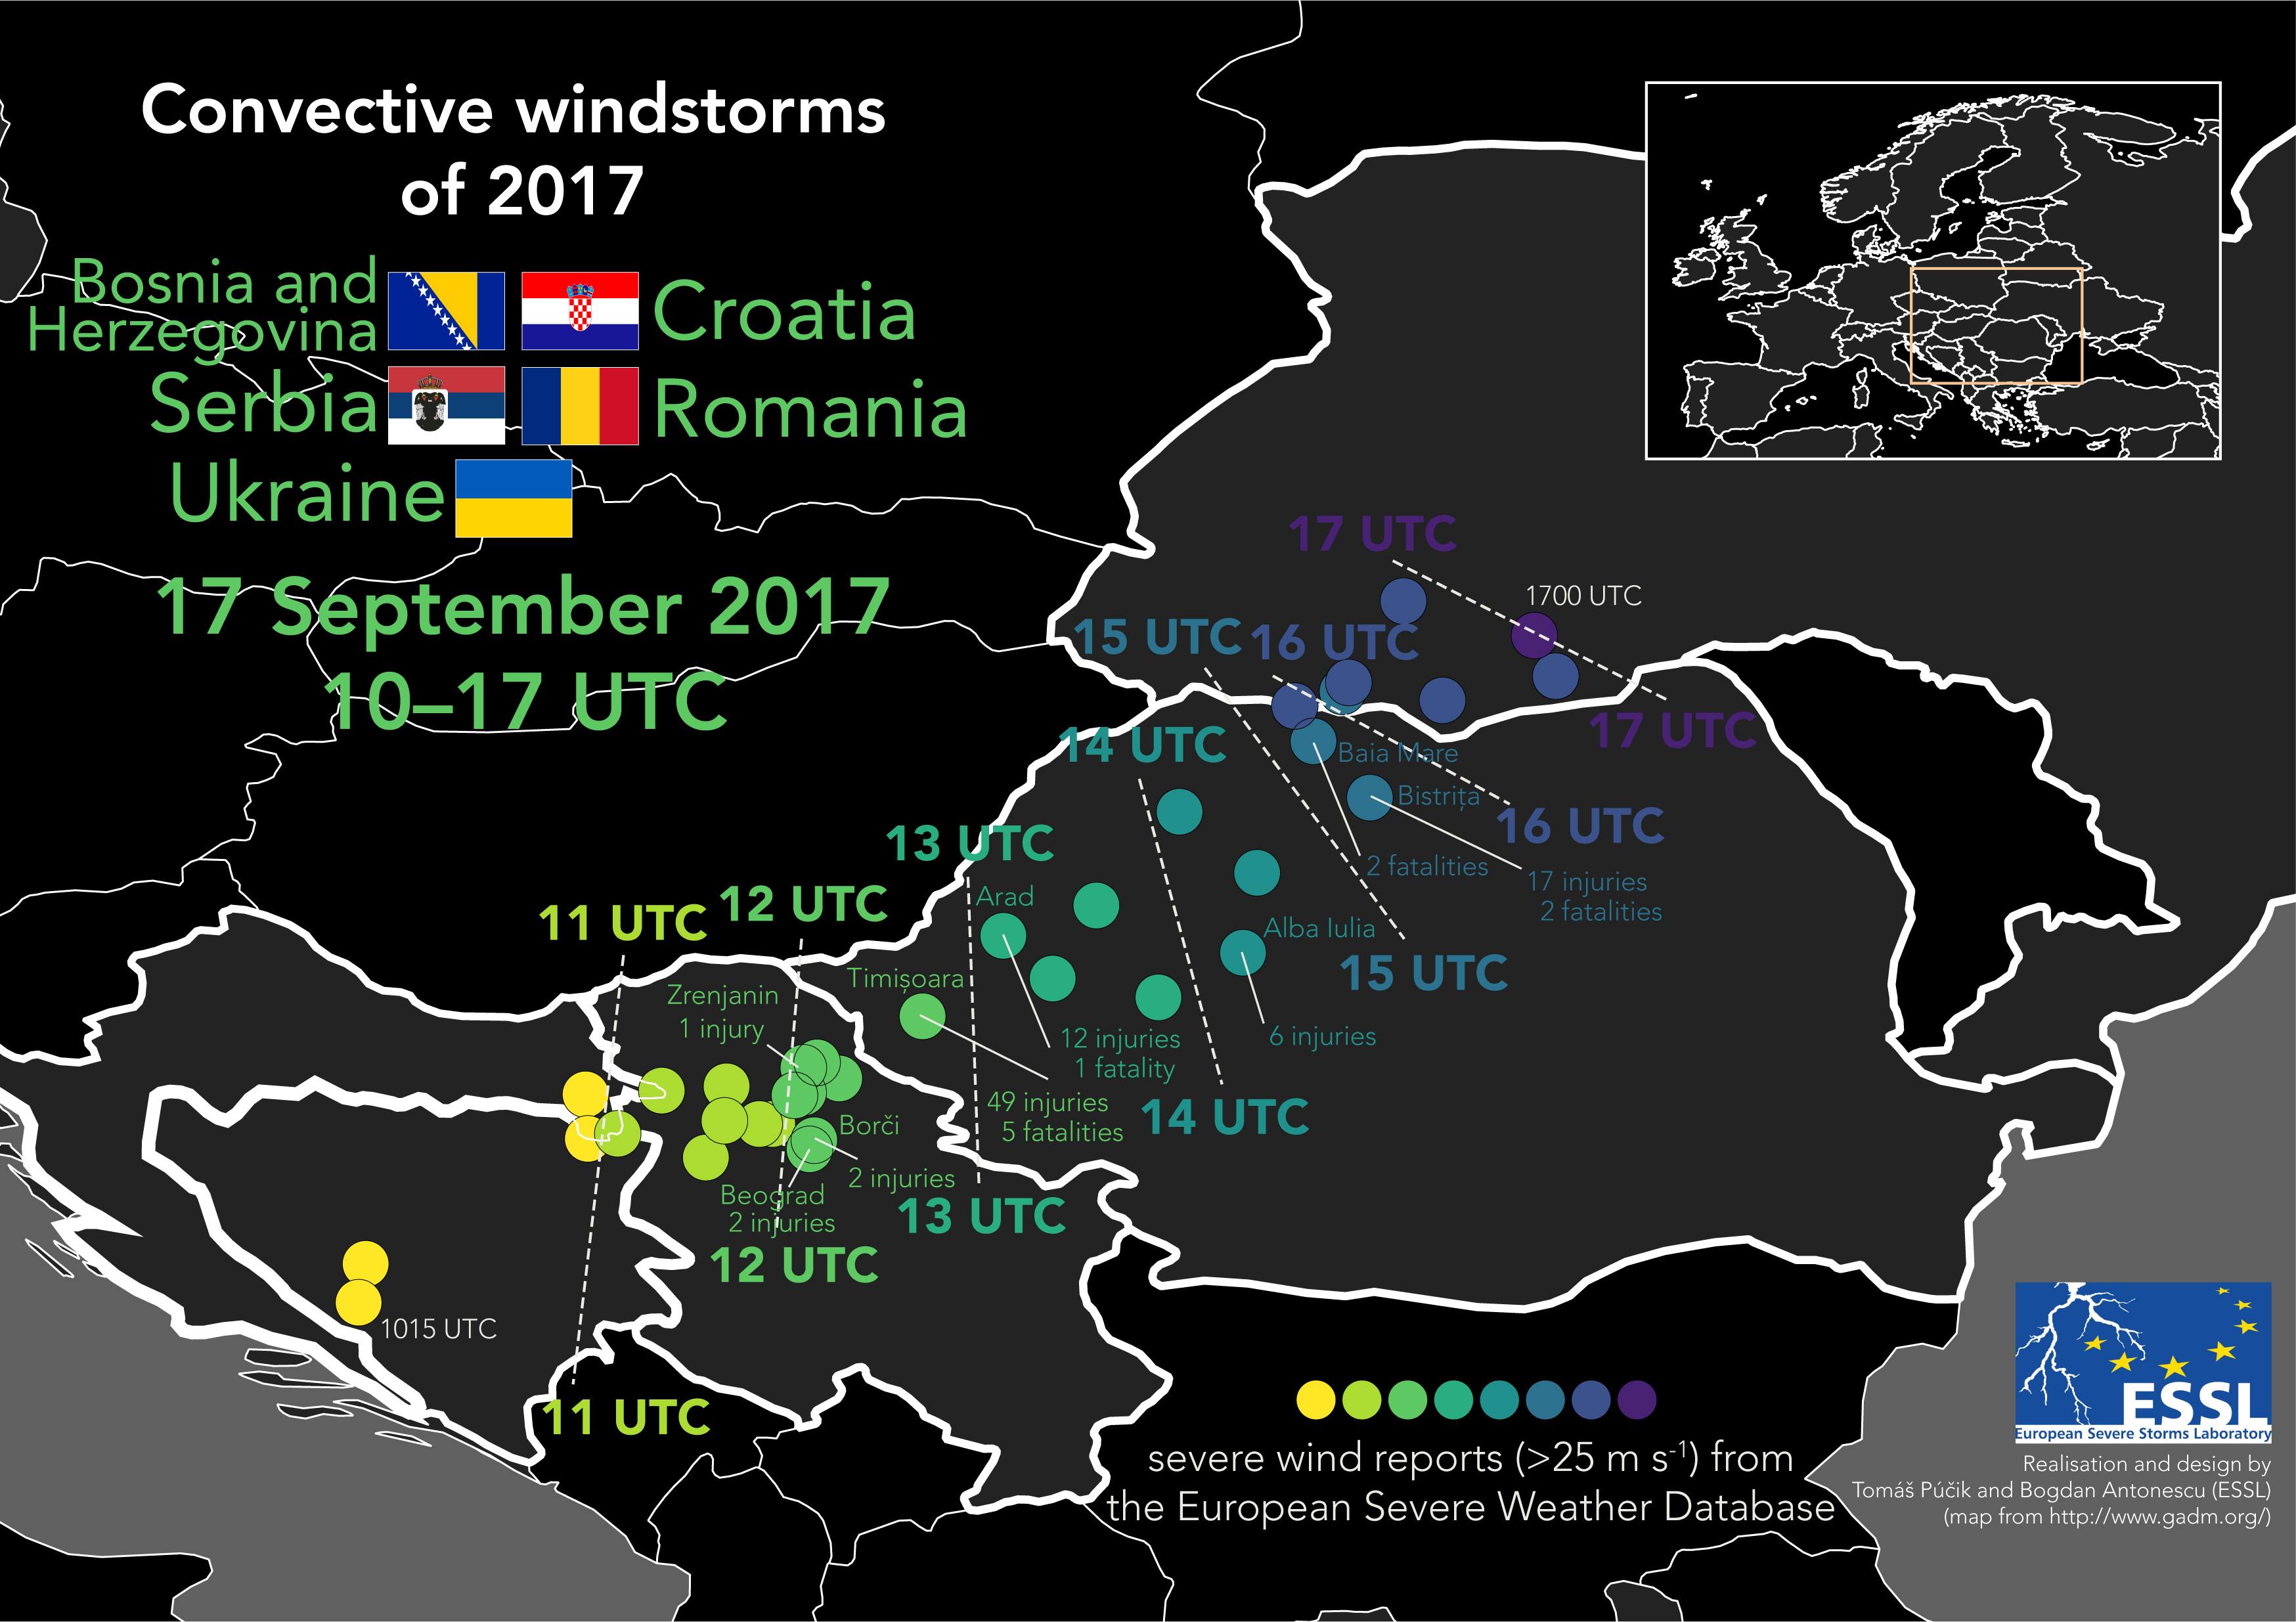
Fig. 1 Chronological progression of severe wind reports in a convective windstorm of 17 September 2017 across southeastern Europe.

Radar observations of the storm show that the system, while not very large, involved very high radar reflectivities of over 60 dBz (Fig. 2). Over northwestern Romania, it attained a classic “bow-echo” shape, which is typically associated with damaging wind gusts (Fig. 3). The system moved extremely fast between Serbia and Romania, covering a distance of 400 km in a mere 3 hours.

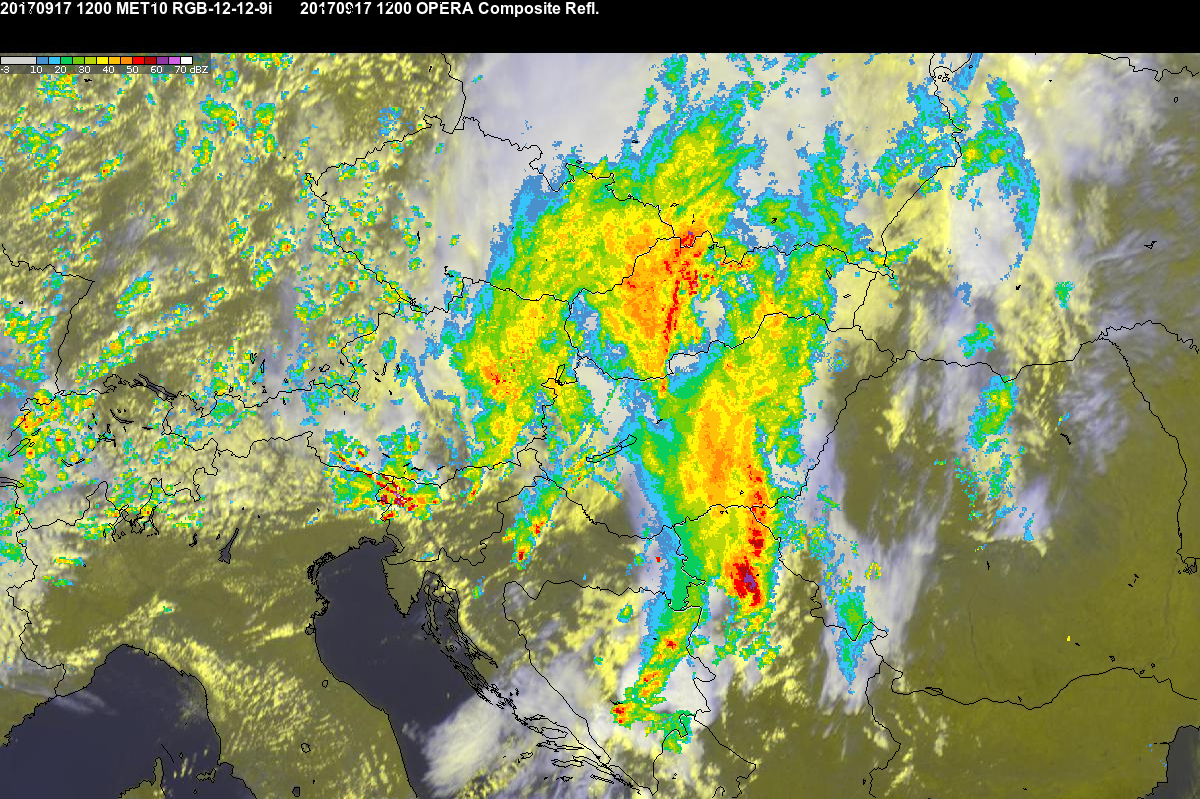
Fig. 2 12:00 UTC satellite (combination of visible and infrared channels and radar (OPERA composite) imagery. OPERA radar data © EUMETNET, satellite data © EUMETSAT.

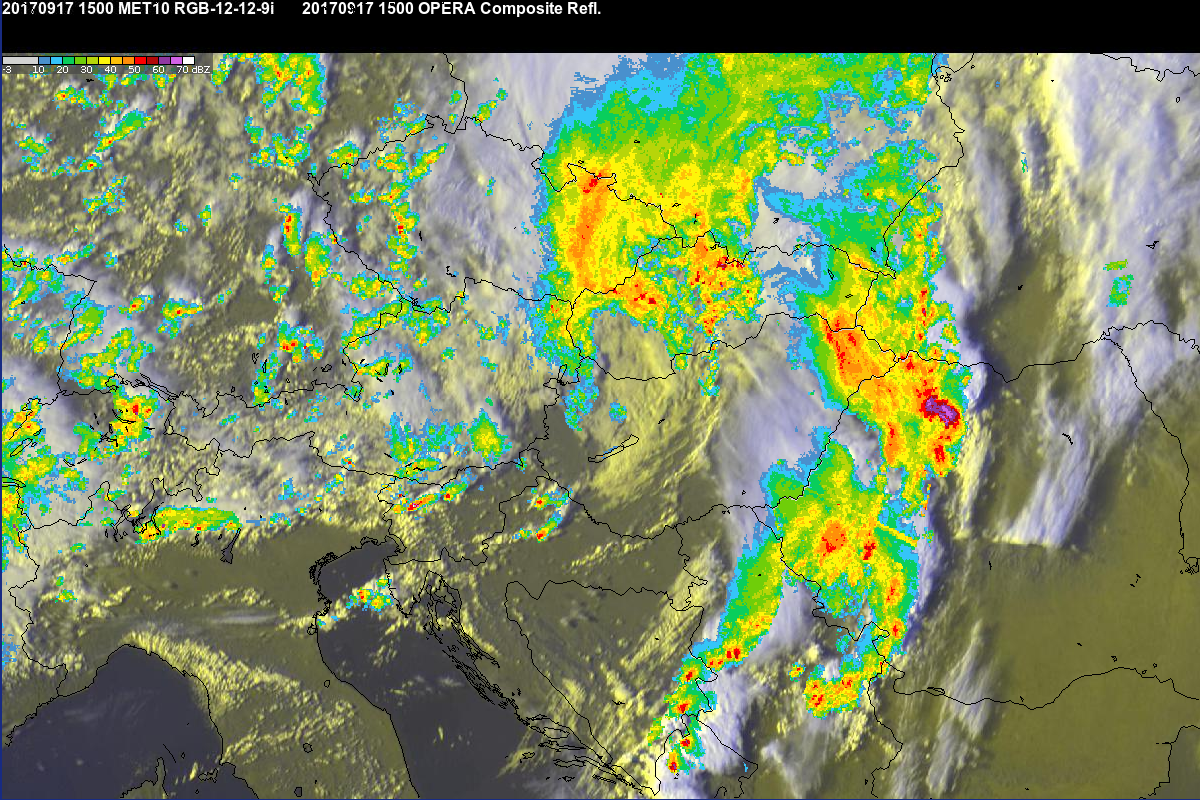
Fig. 3 15:00 UTC satellite (combination of visible and infrared channels) and radar (OPERA composite) imagery. OPERA radar data © EUMETNET, satellite data © EUMETSAT.

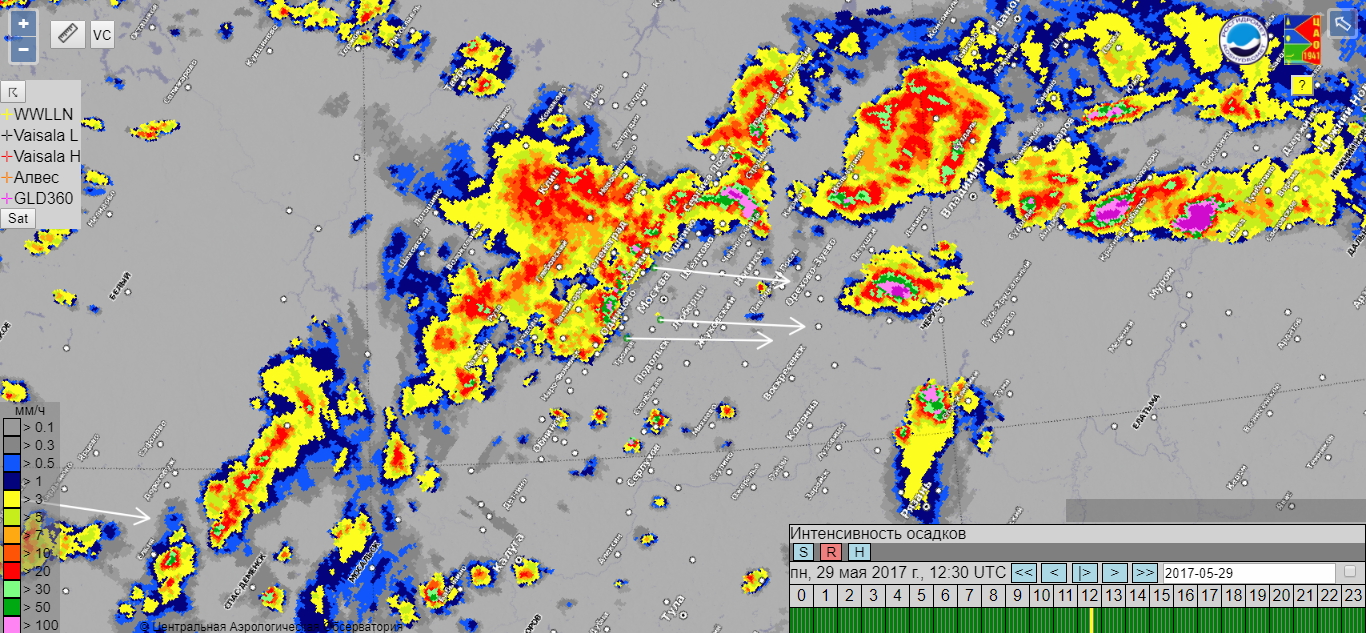
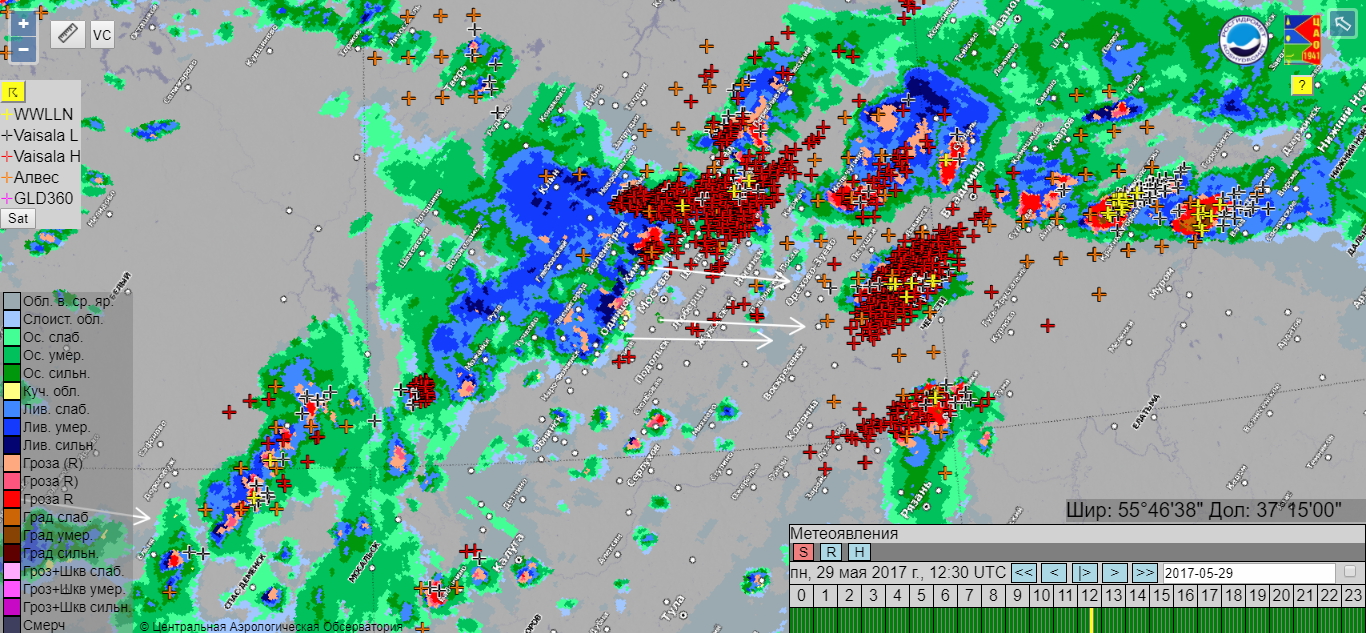
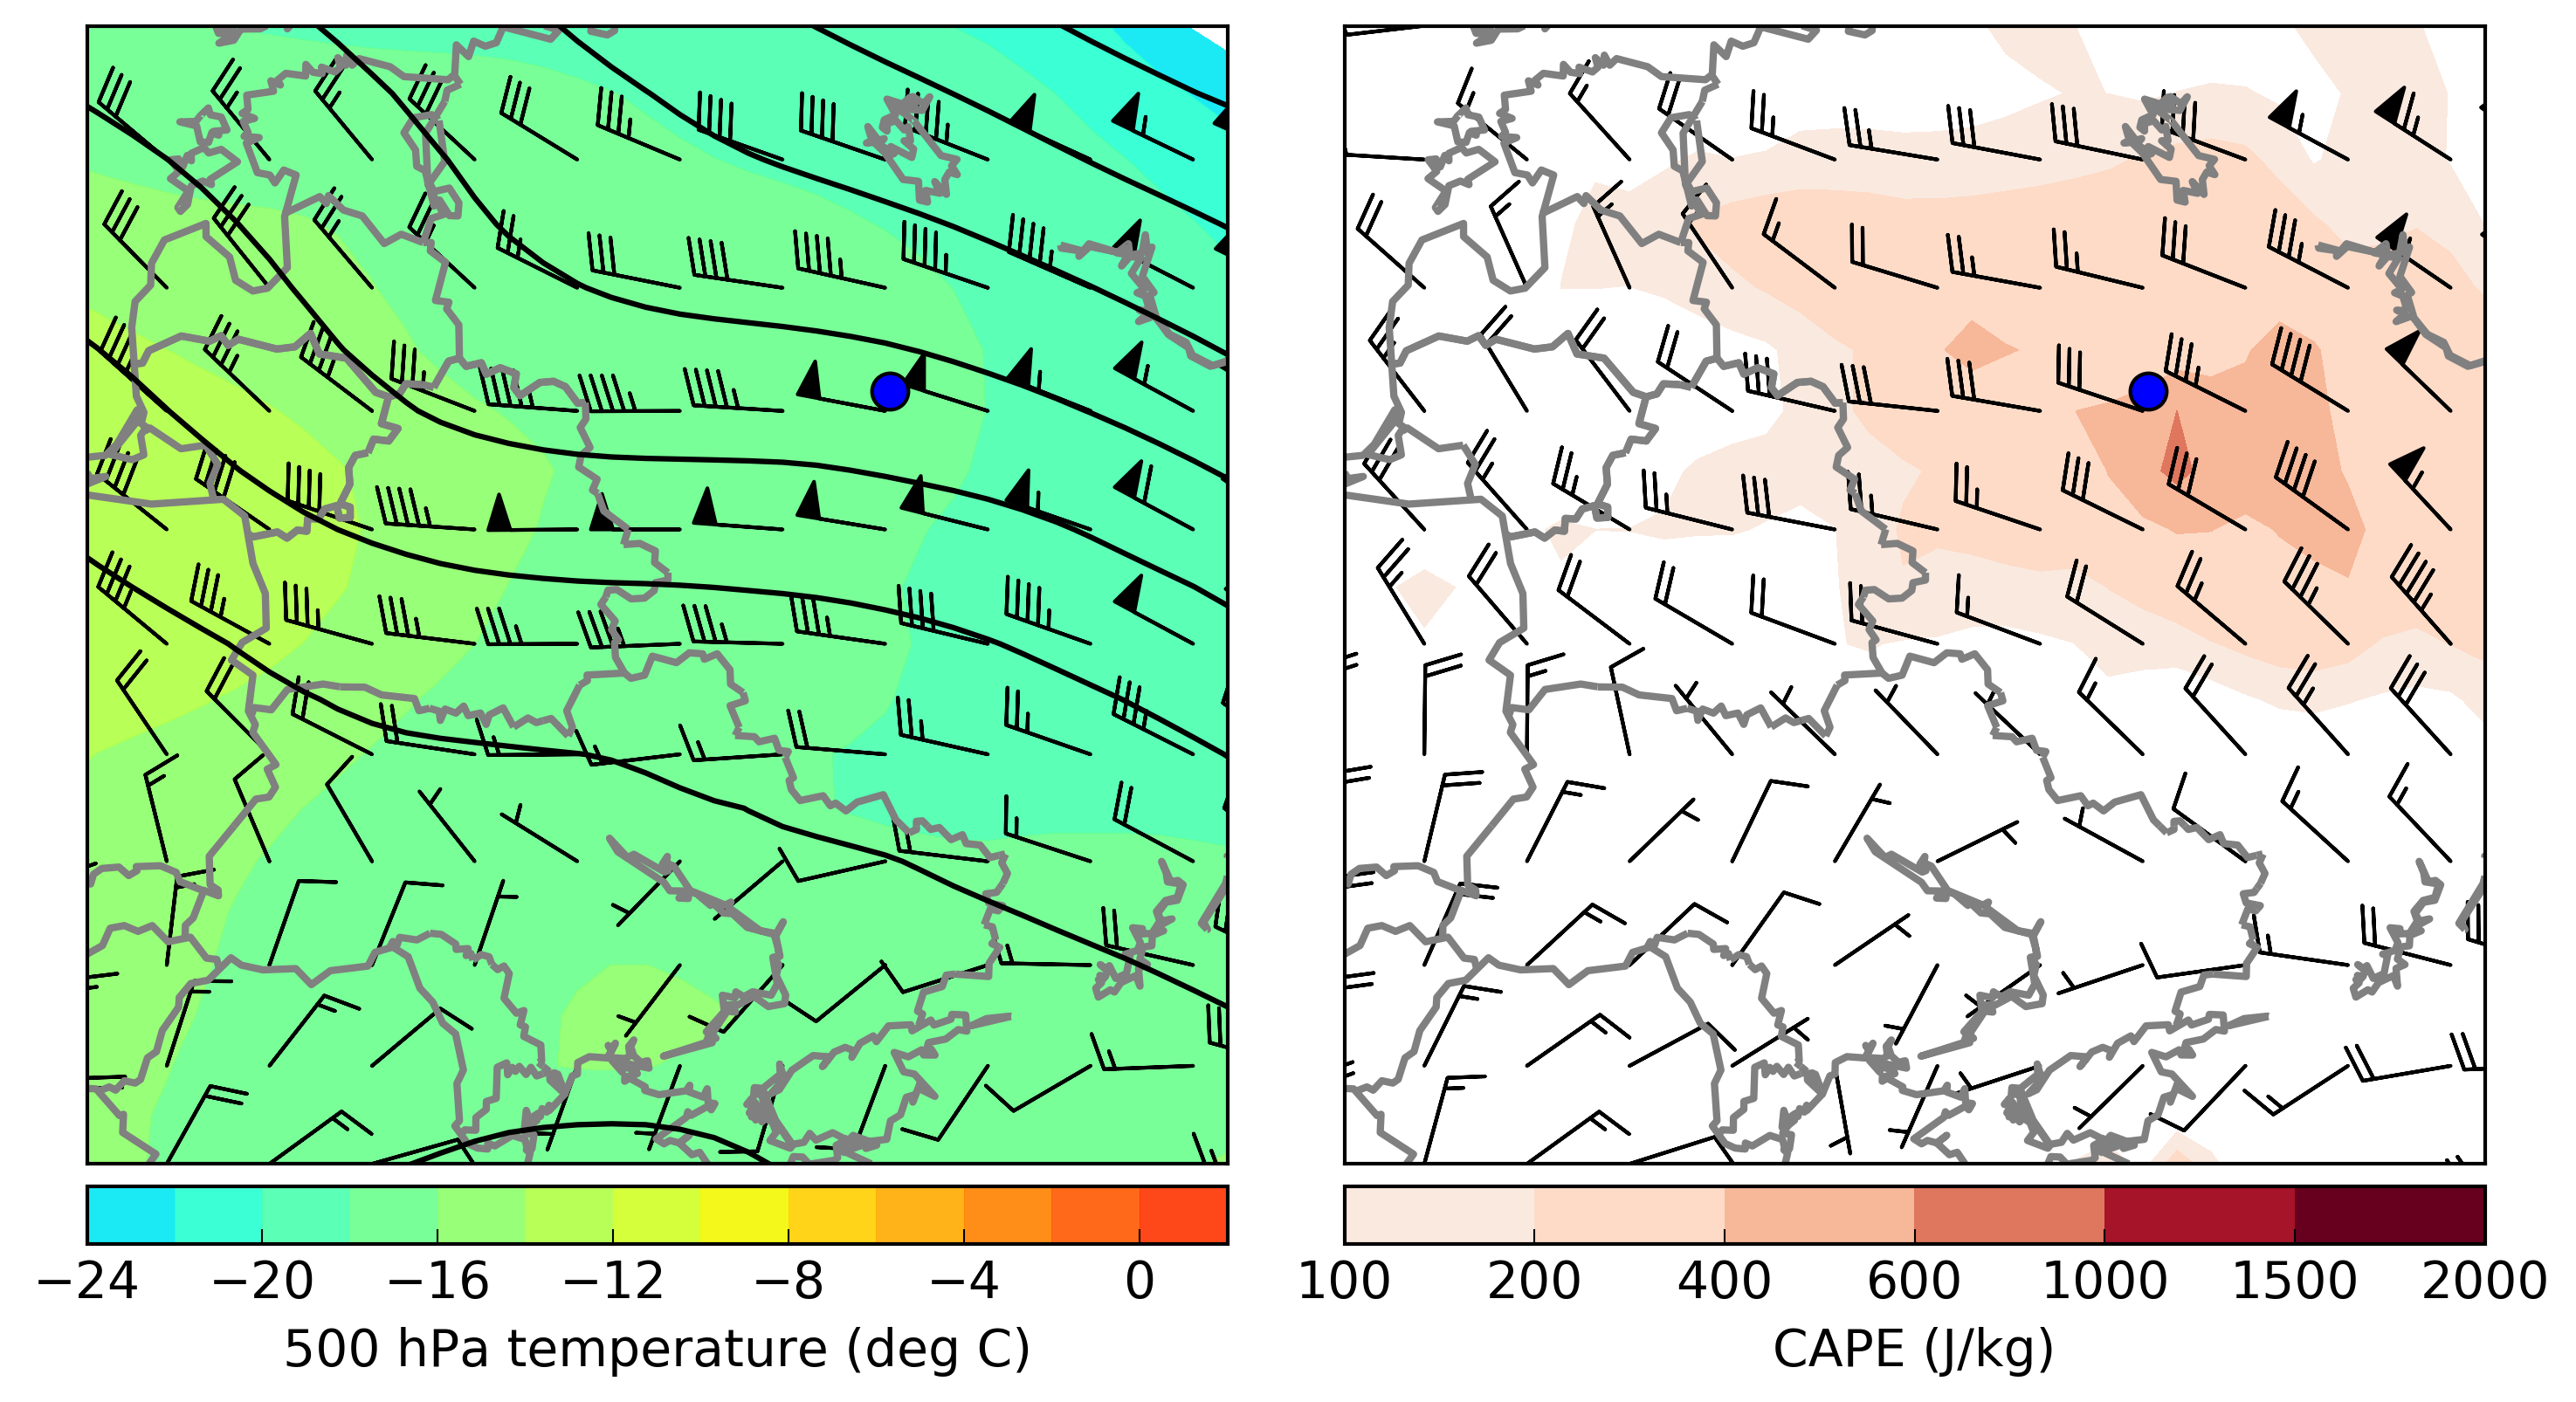
The fast movement speed could be attributed to the combination of strong background flow in the atmosphere and a strong cold pool of the system, as the temperature dropped by over 10°C at some locations in the path of the storm. The convective system formed ahead of the deep trough with strong southwesterly flow exceeding 30 m/s and 20 m/s at 500 and 700 hPa respectively. (Fig. 4) Combined with southerly to southeasterly flow at the surface of around 5 m/s, very strong vertical wind shear was present, conducive to well-organised convection. The 12 UTC sounding taken from Beograd just south of the storm system reveals very dry air in the lower troposphere and confirms the presence of pronounced vertical wind shear. In this perspective, the situation actually resembles the Moscow case of 29 May 2017. While the original sounding does not show any CAPE, its modification with observed dewpoints above 10°C ahead of the storm shows that enough CAPE was present for development of deep convective updrafts with high cloud bases (Fig. 5).

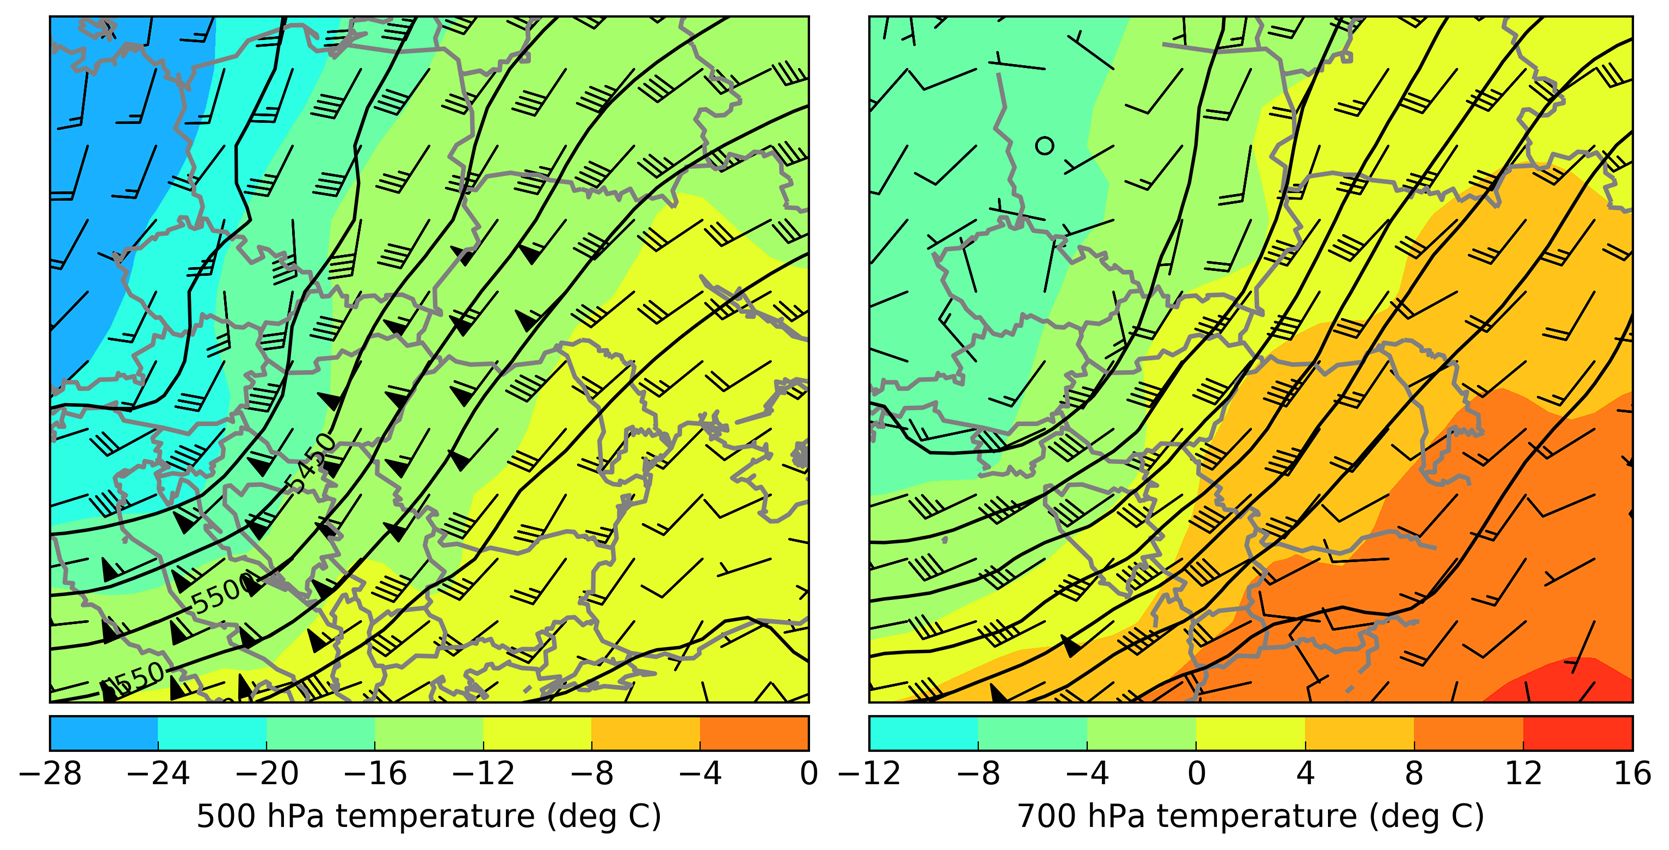
Fig. 4 17 September 2017 12 UTC (Left) 500 hPa geopotential height (black contours), temperature (colour scale) and wind barbs, (Right) The same as left, but for 700 hPa. Data based on ERA-Interim reanalysis.

Fig. 5 Modified Beograd 12 UTC sounding. Green line represents modified dew point curve, orange line represents the Lifted Condensation Level (LCL) and red hatching CAPE for modified surface parcel. Courtesy of University of Wyoming.

The presence of rather dry conditions at the surface led to the development of a dust storm along the gust front of the storm. Besides the spectacular appearance (Fig. 6), however, dust storm created very dangerous driving conditions with practically zero visibility, as evidenced by numerous videos submitted by surprised drivers.

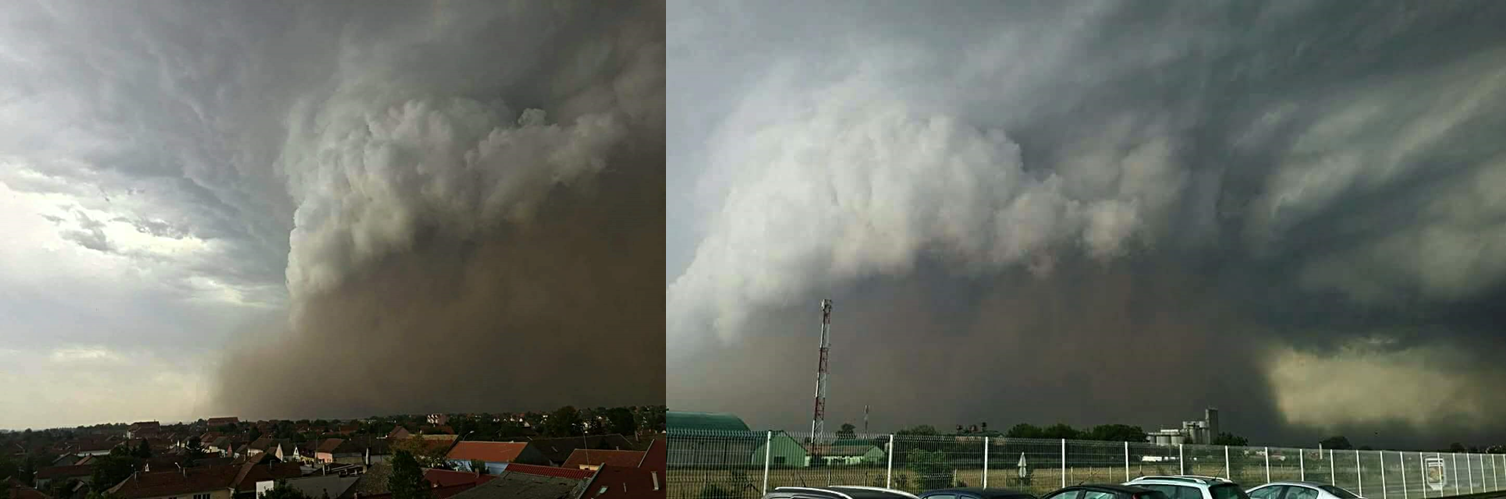
Fig. 6 Photographs depicting dust lofted ahead of the progressing storm near Inđija, Serbia. Courtesy of Dejan Primorac.

ESSL would like to thank Severe Weather Serbia for the wealth of information they provided about this event, as well as Dejan Primorac for his agreement to share the photos of the dust storm.


New statistical method shows increases in European hail and lightning

Researchers at ESSL, Munich Re, the Ludwig-Maximilians University Munich (LMU) and the German Aerospace Centre DLR have developed a new statistical method to investigate trends in thunderstorm and severe weather activity. Anja Rädler, the main developer of this method, called AR-CHaMo, will defend her Ph.D. thesis on this topic at LMU.

Anja Rädler says: “the strength of our approach is that we are now able to assess changes in severe weather frequency using climate models that are themselves too coarse to simulate each and every thunderstorm”. To do this, the probability of lightning and severe weather is determined as a function of parameters such as instability, moisture and wind shear, using severe weather observations from ESSL’s European Severe Weather Database.

Annual number of 6-hourly periods with hail of 2 cm or larger in Europe (1979 - 2016), modelled using AR-CHaMo. From: Rädler et al, 2018.

Annual number of 6-hourly periods with hail of 2 cm or larger in Europe (1979 – 2016), modelled using AR-CHaMo. From: Rädler et al, 2018.

In a new article in the Journal of Applied Meteorology and Climatology, the development of AR-CHaMo is explained in detail, and trends of lightning and severe weather frequency since 1979 are presented. The basis of these projections are a numerical model (ERA-Interim), that simulates the past weather since 1979. The annual average predicted number of large hail events (see map below) conforms quite well to what we know: the Alpine forelands are the Europe’s hailfall hotbed.

The number of simulated hail events was not constant during the last three decades. When considering hail activity over Central Europe, significant increases are detected.

Simulated number of 6-hourly periods with hail > 2 cm across Germany and the Alps (blue) and Western and Central Europe (green), 1979-2016.

Simulated number of 6-hourly periods with hail > 2 cm across Germany and the Alps (blue) and Western and Central Europe (green), 1979-2016. From: Rädler et al, 2018.

Of course, it is of interest to know what the reason for the increase is. Anja Rädler: “we found that the driving factor is the increasing humidity close to the earth’s surface. This is something we expect to happen when temperatures increase, because warmer air can contain more moisture.” Indeed, temperature has increased since 1979, at least partly, because of the rising CO2 content of the atmosphere.

The map below shows which areas have seen the strongest increase, according to ERA-Interim and the AR-CHaMo model.

Trend of number of 6-hourly periods with severe hail (1979-2016). Dots denote where a ignificant trend was found.

Trend of number of 6-hourly periods with severe hail of 2cm or larger (1979-2016). Dots denote where a ignificant trend was found. From: Rädler et al, 2018.

The next question Anja and her team will address is what will happen in the future. First results that were published by the ESSL team in 2017 suggest that the moisture increase will continue and create more situations favorable for severe thunderstorms during the 21st century. Using the new AR-CHaMo method, the team will soon be able to give an estimate of how much more hail, tornadoes, severe winds and lightning we should count on in different climate change scenarios.

Convective windstorms in 2017 Episode 1: 29 May

As promised, we would like to bring you an overview of the major convective windstorms in Europe last year.

The first event we are going to cover is the case of 29 May 2017 in Russia. This event did not feature one of the longest-lived convective windstorms of that year in Europe, nor did it involve the highest measured wind gusts (which reached up to 30 m/s). Yet, its societal impact was the largest of all the cases. As the windstorm hit the metropolitan area of Moscow, it resulted in 18 fatalities and 168 injuries (economic loss estimated at 25 million rubles). The first reports of wind damage came in from 11:15 UTC. Between 12 and 13 UTC, the convective system reached its maturity as it passed over Moscow and it decayed shortly after 14 UTC (Fig. 1).

Fig 1. Chronological progression of severe wind reports in a convective windstorm of 29 May 2017 in the Moscow area.

Radar imagery shows that at 12:30, a linearly oriented convective system was moving into the Moscow area. The convective system was not particularly large, without very high reflectivity values and did not show a classic “bow-echo” structure, which would typically be associated with damaging wind gusts (Fig. 2). The apparent lack of strong updrafts was also confirmed by virtually no lightning activity in the southern part of the system (Fig. 3).

Fig 2. Precipitation intensity (mm/h) s in Moscow region for 12:30 UTC 29.05.2017 (data from Web-GIS ‘Meteorad’ of the Central aerological observatory based on Roshydromet radar network). Arrow points to the direction of the storm movement.

Fig. 3 Combined information on weather phenomena (based on Roshydromet radar network) and lighting detection networks (WWLN, ALVES, Vaisala LS-8000) in Moscow region for 12:30 UTC 29.05.2017 (data from Web-GIS ‘Meteorad’ of the Central aerological observatory). Arrow points to the direction of the storm movement.

The reason for this untypical behaviour were the background environmental conditions. The convective storm formed ahead of an advancing mid-tropospheric trough (Fig. 4 left). Buoyancy was rather low with CAPE values around 400 J/kg according to the Era-Interim. At the same time, vertical wind shear was moderate, with 0-6 km bulk shear values around 15 m/s (Fig. 4 right). Overall, the environment did not seem to be too favourable for an extremely severe convective event, which would be typically anticipated in high CAPE and high shear regime. However, a combination of very strong flow in the lower troposphere and a dry boundary layer (Fig. 5) created favourable conditions for powerful downdrafts transporting high momentum air down from above.

Fig. 4 (Left) 500 hPa geopotential height (black contours), temperature (colour scale) and wind barbs, (Right) CAPE (colour scale) and 0 – 6 km bulk vertical wind shear (wind barbs) for 29 May 2017 12 UTC according to ERA-Interim reanalysis. Blue dot represents location of Moscow.

Fig. 5 Moscow Dolgoprudnyj 12 UTC sounding. Courtesy of University of Wyoming.

The convective system weakened soon after leaving the Moscow area, probably suffering from the lack of ideal environmental conditions. Nevertheless, this case  illustrates that high-impact convective windstorms are possible in a wide variety of conditions.

ESSL would like to thank Alexander Chernolusky from the A. M. Obukhov Institute of Atmospheric Physics for his contribution to this case study.