
Researchers at ESSL, Munich Re, the Ludwig-Maximilians University Munich (LMU) and the German Aerospace Centre DLR have developed a new statistical method to investigate trends in thunderstorm and severe weather activity. Anja Rädler, the main developer of this method, called AR-CHaMo, will defend her Ph.D. thesis on this topic at LMU.
Anja Rädler says: “the strength of our approach is that we are now able to assess changes in severe weather frequency using climate models that are themselves too coarse to simulate each and every thunderstorm”. To do this, the probability of lightning and severe weather is determined as a function of parameters such as instability, moisture and wind shear, using severe weather observations from ESSL’s European Severe Weather Database.
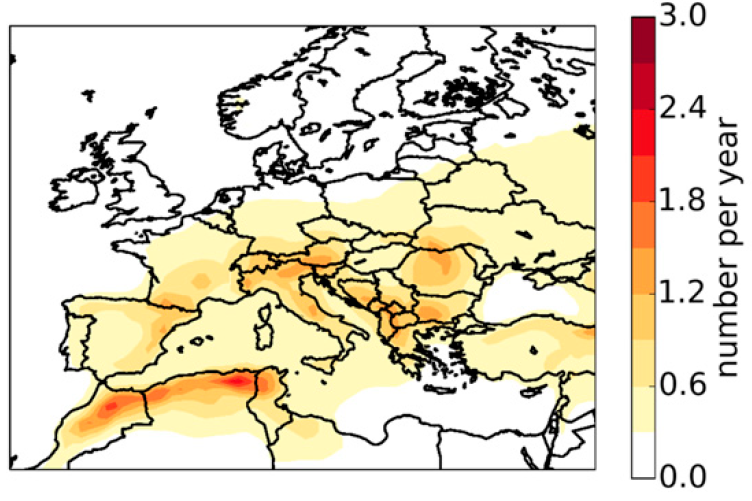
Annual number of 6-hourly periods with hail of 2 cm or larger in Europe (1979 – 2016), modelled using AR-CHaMo. From: Rädler et al, 2018.
In a new article in the Journal of Applied Meteorology and Climatology, the development of AR-CHaMo is explained in detail, and trends of lightning and severe weather frequency since 1979 are presented. The basis of these projections are a numerical model (ERA-Interim), that simulates the past weather since 1979. The annual average predicted number of large hail events (see map below) conforms quite well to what we know: the Alpine forelands are the Europe’s hailfall hotbed.
The number of simulated hail events was not constant during the last three decades. When considering hail activity over Central Europe, significant increases are detected.
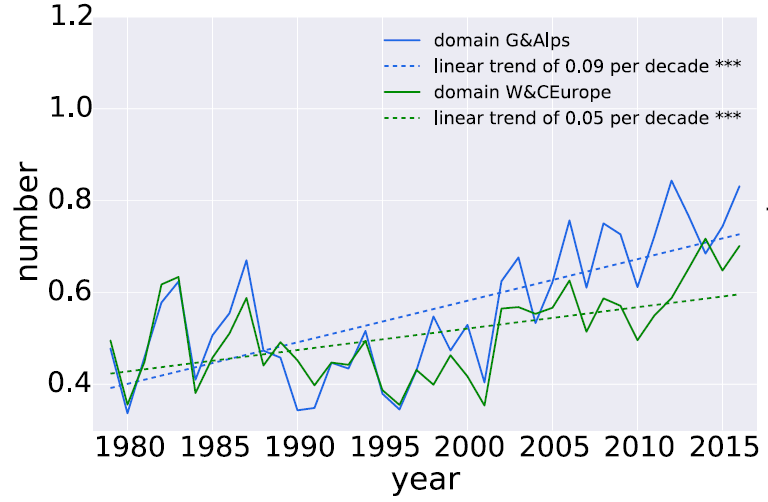
Simulated number of 6-hourly periods with hail > 2 cm across Germany and the Alps (blue) and Western and Central Europe (green), 1979-2016. From: Rädler et al, 2018.
Of course, it is of interest to know what the reason for the increase is. Anja Rädler: “we found that the driving factor is the increasing humidity close to the earth’s surface. This is something we expect to happen when temperatures increase, because warmer air can contain more moisture.” Indeed, temperature has increased since 1979, at least partly, because of the rising CO2 content of the atmosphere.
The map below shows which areas have seen the strongest increase, according to ERA-Interim and the AR-CHaMo model.
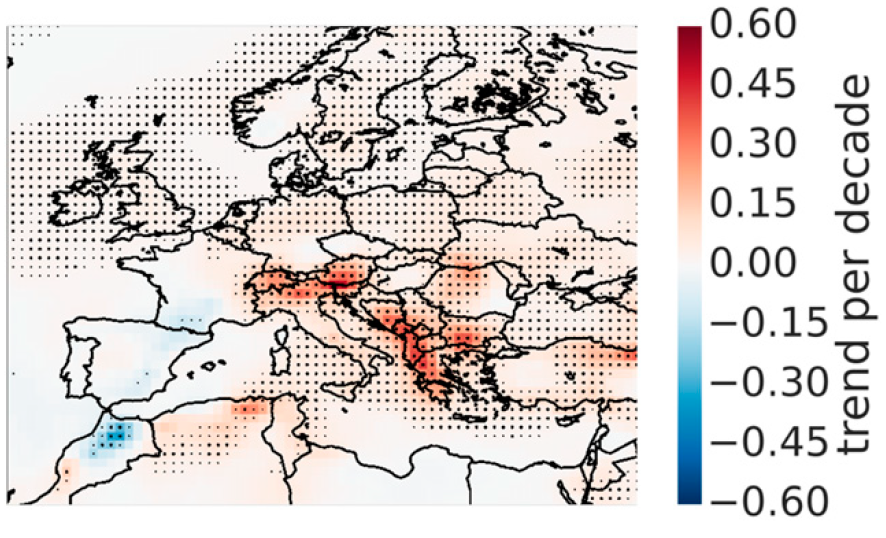
Trend of number of 6-hourly periods with severe hail of 2cm or larger (1979-2016). Dots denote where a ignificant trend was found. From: Rädler et al, 2018.
The next question Anja and her team will address is what will happen in the future. First results that were published by the ESSL team in 2017 suggest that the moisture increase will continue and create more situations favorable for severe thunderstorms during the 21st century. Using the new AR-CHaMo method, the team will soon be able to give an estimate of how much more hail, tornadoes, severe winds and lightning we should count on in different climate change scenarios.
