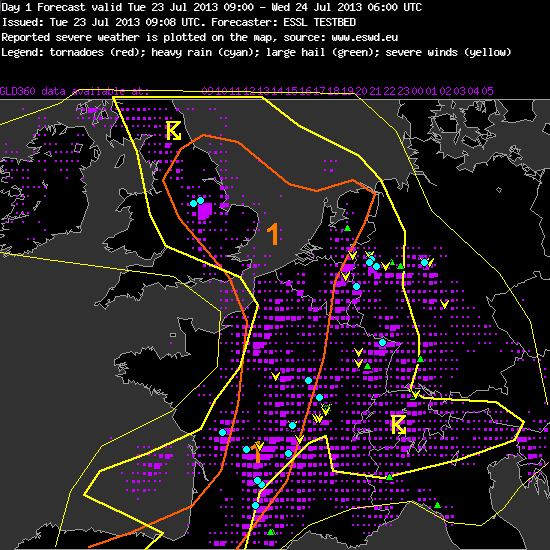
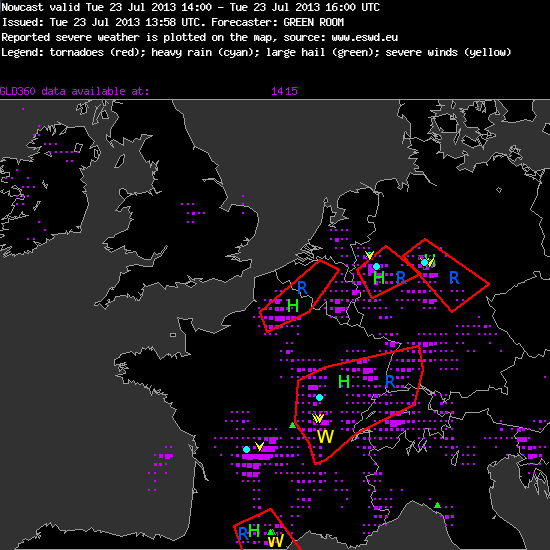
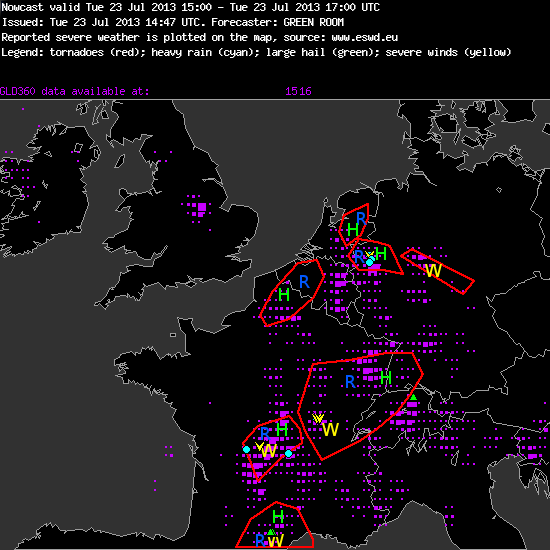
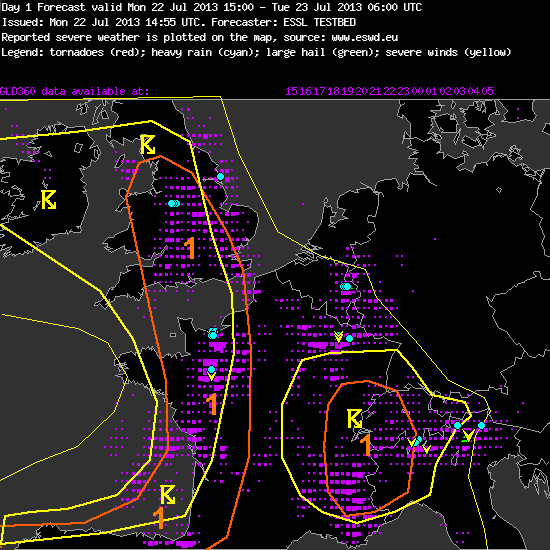
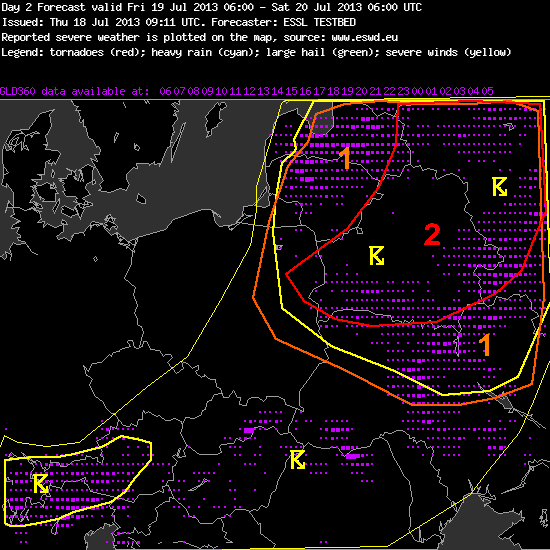
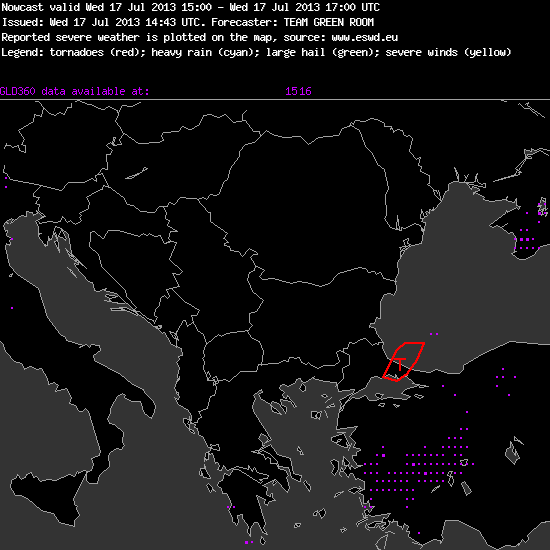
Today saw a premiere: the first tornado watch during the Testbed 2013 was issued! It is presented below in Fig. 1, along with the very comprehensible discussion that was added by the nowcasting team on duty.

Fig. 1: Nowcast issued at 15 UTC Wed 17 July 2013, valid for the 15 to 17 UTC period.
—–
Nowcast
Valid: Wed 17 Jul 2013 15:00 to Wed 17 Jul 2013 17:00 UTC
Issued: Wed 17 Jul 2013 14:43
Forecaster: TEAM GREEN ROOM
Watches for imminent severe weather in the next 120 minutes are issued for these areas:
…extreme northwest Turkey and the adjacent Black Sea…
A persistent convective band over the southwest Black Sea has been sending convective elements southwestward torward the coast in Northwest Turkey just west of Istanbul. This convective line occasionally erupts cirrus plumes at times, which are carried back toward the northeast, as the winds alot above the EL are very strong and of the opposite direction from below. This line also intersects a sea-breeze convergence line which is evident from visible satellite imagery.
Although there is very little supporting evidence of a within in the sprase surface data, and the boundary layer air over the Black Sea does not appear to be appreciably colder than the sea-surface temperature, the visible and local radar trends suggest that this persistent convective line is associated with a local convergence zone. The numerical models support CAPE values anywhere from 500-1000 J/kg, suggesting there may be adequate instability to stretch any possible vertical vorticity along the convergence zone into a brief non-mesocyclone tornado over the water (a waterspout). Any waterspouts that form close to the coast have the possibility to move onshore and cause weak tornadic damage.
—–
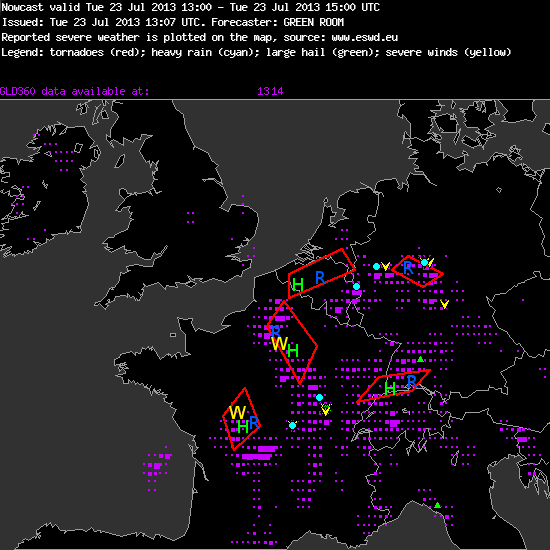
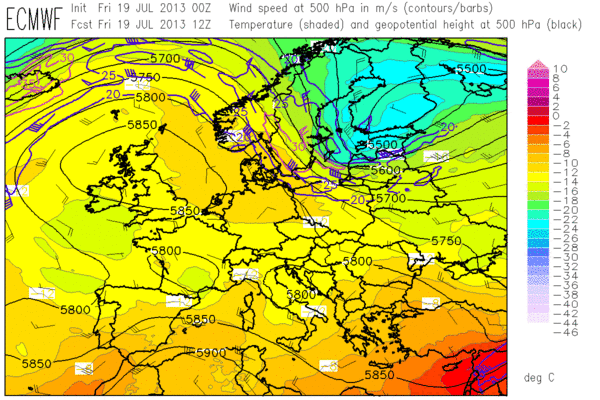
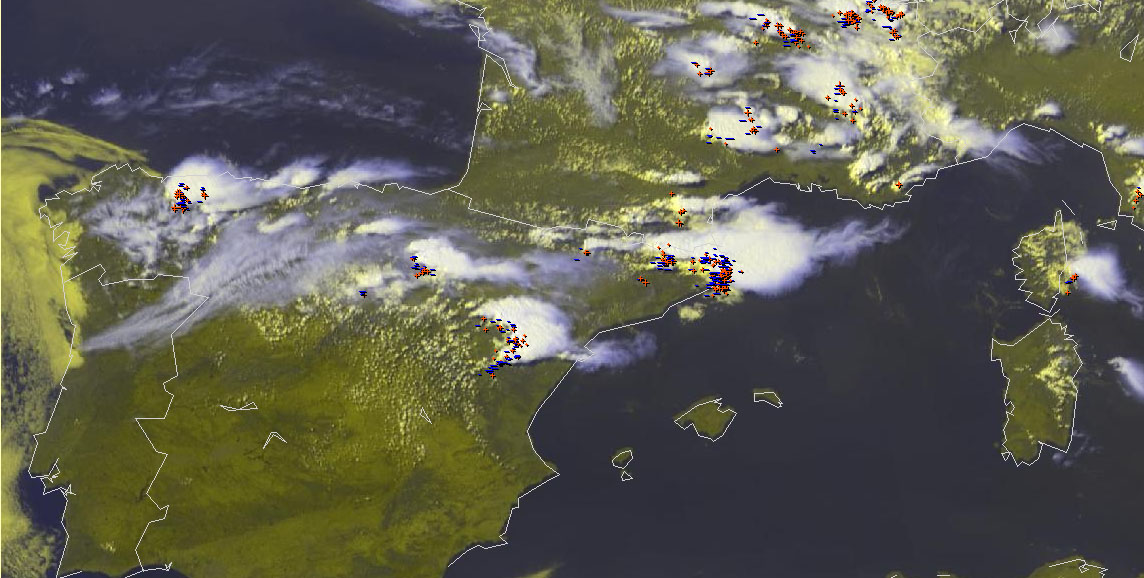
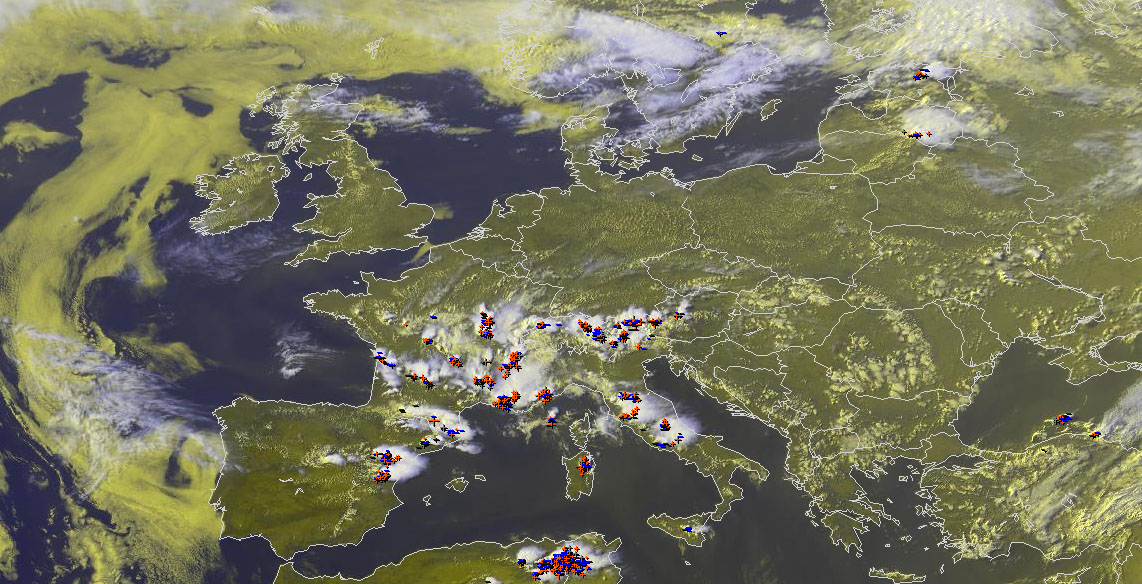
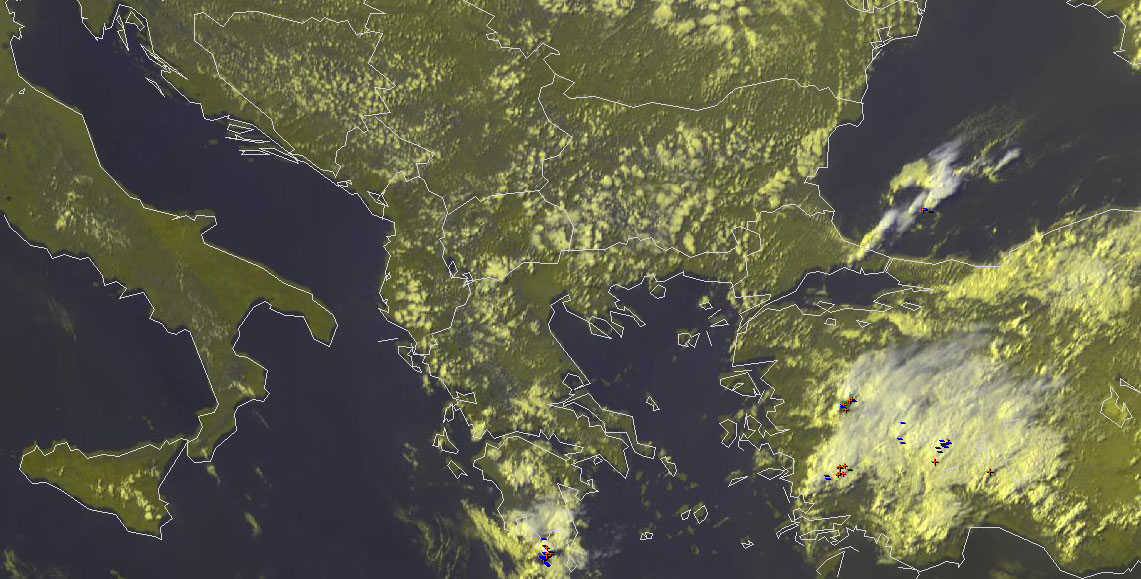
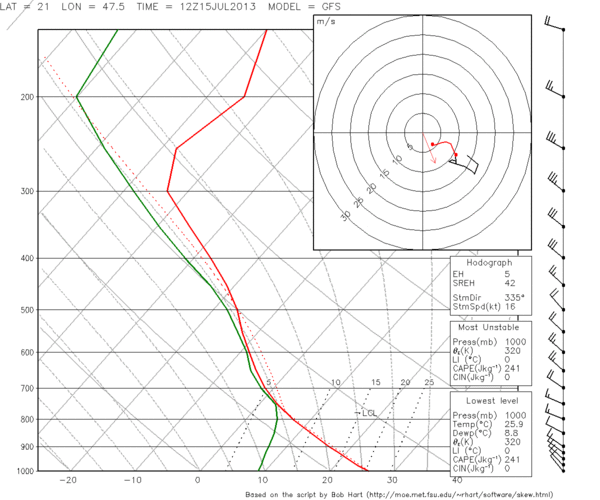
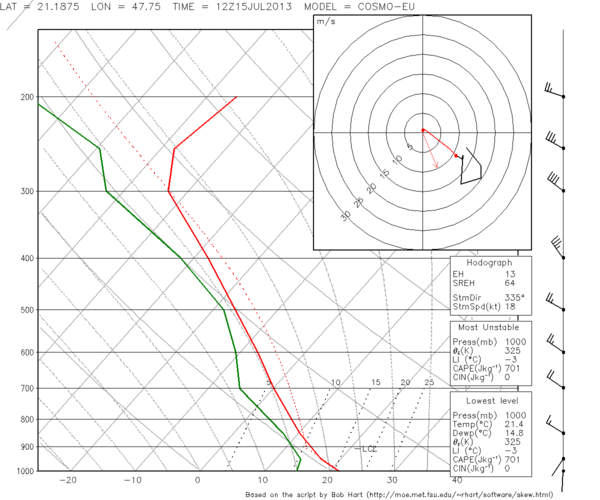
Fig. 2 shows the cumulus band over the Black Sea which prompted the team to issue this tornado watch, and Fig. 3 presents the 12 UTC Istanbul sounding. The rather cool upper levels in the vicinity of the weak cut-off low over the Balkans resulted in at least a little bit of uncapped CAPE over the Black Sea. The pronounced low-level Northeasterly winds and the upper-level Southwesterly winds can clearly be seen in the sounding. This bizarre wind profile resulted in well-organized showers with weak electrification, which very slowly moved to the Southwest while their anvils were carried away in the opposite direction. The intersection of this supposed convergence line with the usual “frictional” convergence along the coast (visible by small cumulus clouds in Fig. 2) was a suspicious setup for a concentration of low-level vorticity into a waterspout spin-up. We were particularly aware of this scenario, because yesterday two spouts were observed at the Romanian coast in a very similar setup of two intersecting convergence lines. Till the time of writing, no spout reports from the Istanbul area have arrived yet, though.

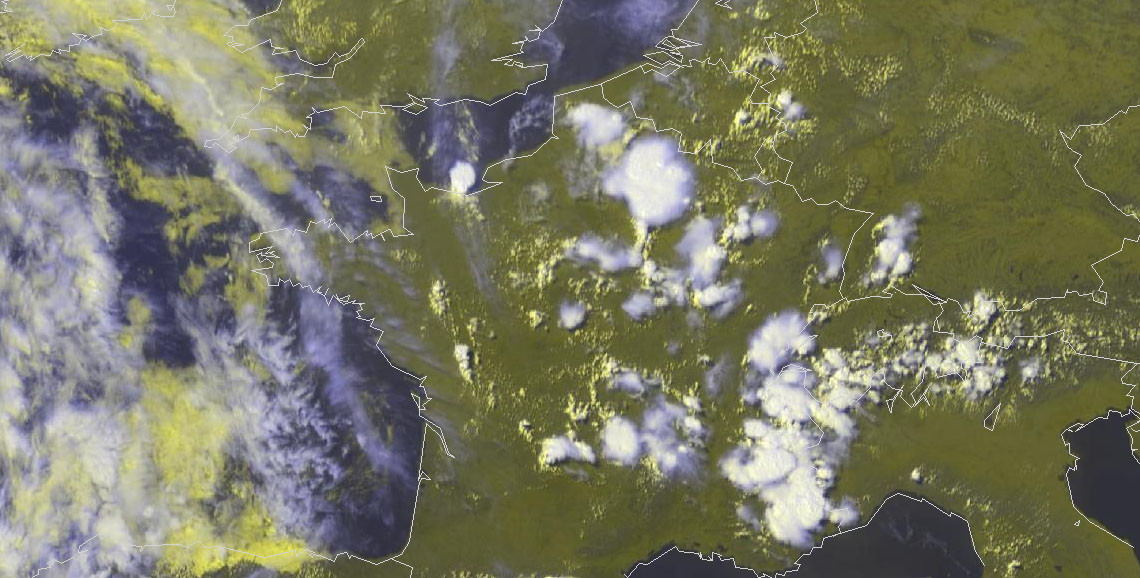
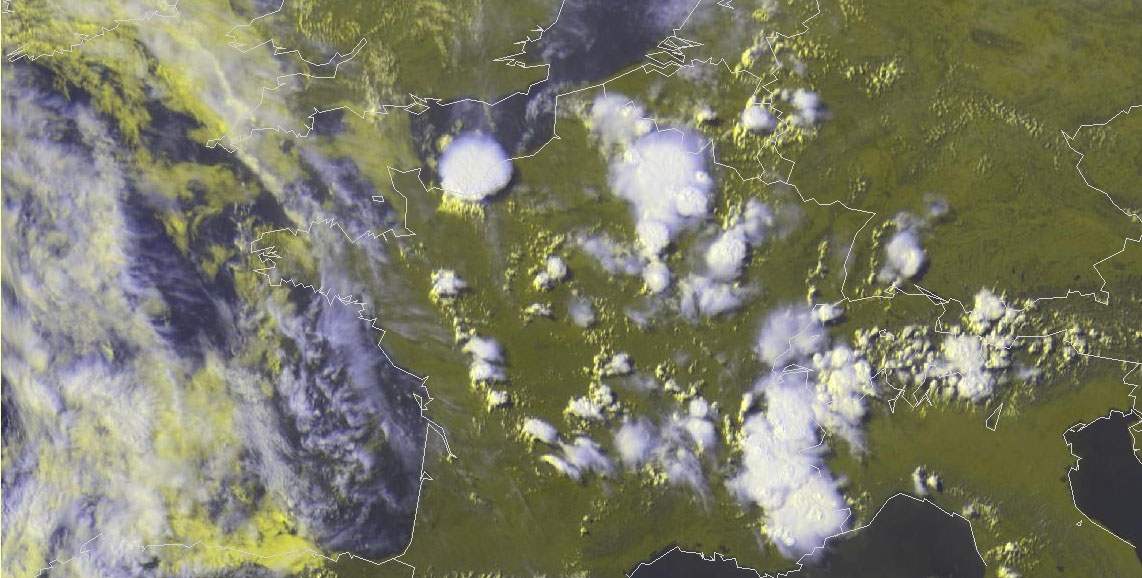
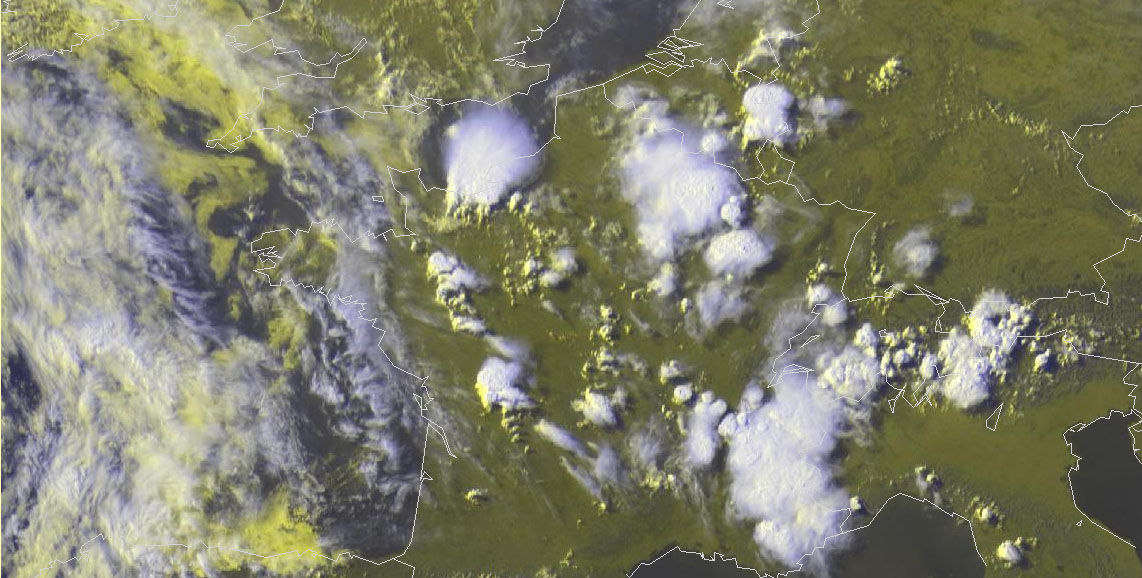
Fig. 2: Nowcast display at 1430 UTC Wed 17 July 2013: Meteosat E-View satellite image and lightning detections within the last 5 minutes.
Fig. 3: 12 UTC Wed 17 July 2013 sounding from Istanbul (Turkey).
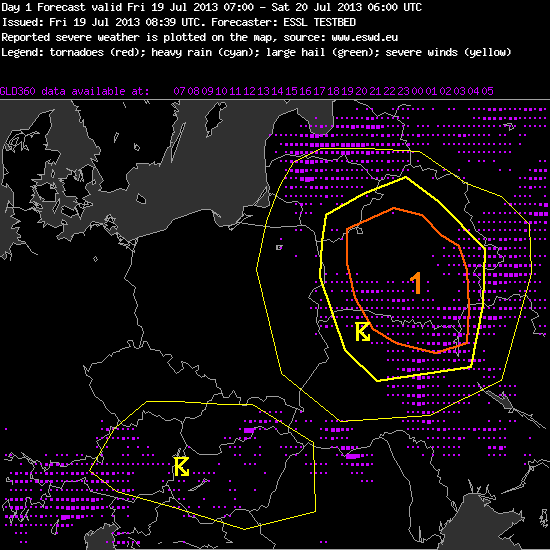
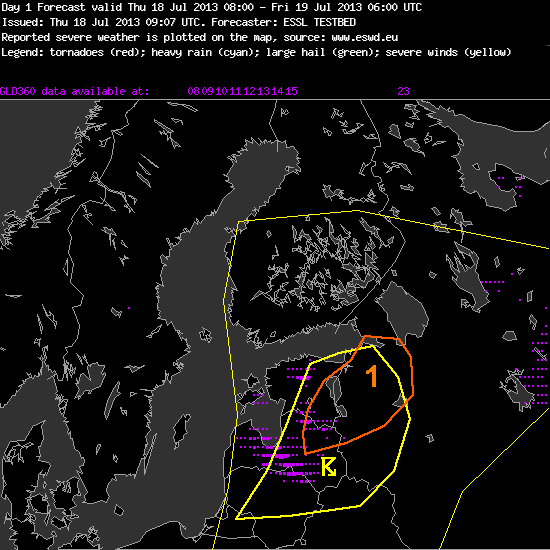
Apart from that, it seems like the participants get a bit fed up with forecasting the almost same Spanish storms from day to day. The day 1 team this morning chose the Sofia domain (independent from the surprising Istanbul scene, but for a chance of organized storms under strong Southwesterly upper-level flow over the Turkish mainland, which did not really materialize), and the day 2 team even switched to the Helsinki domain. More on this foreseeable change over Northeastern Europe will be written tomorrow.
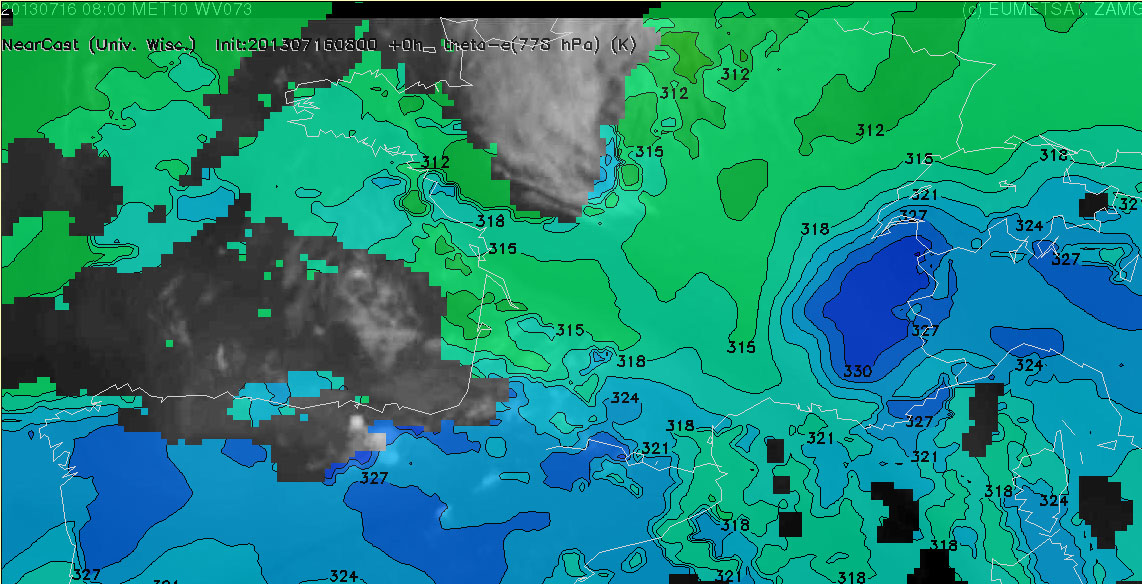
Before that, however, still the nowcasting was arguably today’s most interesting part: Yesterday’s storms over Northern Spain and Southern France did not only bring another regional outbreak of severe weather, but also provided a good opportunity to test the “NearCast” product developed by Ralph Peterson from the University of Wisconsin, who is also on site in Wiener Neustadt this week.
This product displays fields of the equivalent-potential temperature at 778 and 497 hPa derived from satellite retrievals. These fields are computed hourly (at least in areas where no obstructive cloudiness is present), and a Lagrangian advection with GFS forecast winds is computed for up to 9 hours into the future. Users can switch between a separate view of either of these fields, or of the resulting difference, which shows potentially stable or unstable areas. The NearCast product has been a matter of active discussions for the whole Testbed period, as not everybody agrees on the concept of potential instability: critics claim that it is rather a “proxy” for good or not good conditions for convection than it actually reflects the physics of (surface-based) convection. Though not everybody acknowledged the product’s added value in comparison to conventional satellite products, it was generally agreed that it performed well.
During yesterday’s treatment of the French storms, Ralph pointed out another, less obvious possibility to use the 778 hPa theta_e field alone. In a quiescent situation like the present one with an absence of pronounced horizontal temperature variations, its maxima and minima can chiefly be interpreted as local maxima or minima of moisture on top of the growing convective boundary layer. A moisture minimum at ~800 hPa means that vertical mixing will effectively reduce the near-surface moisture by means of strong upward mixing as soon as the convective boundary layer grows deep enough. Conversely, near-surface moisture is largely preserved if the layers around 800 hPa also show a high moisture content.
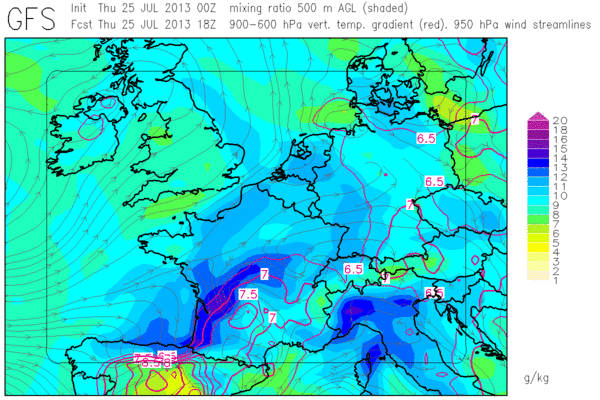
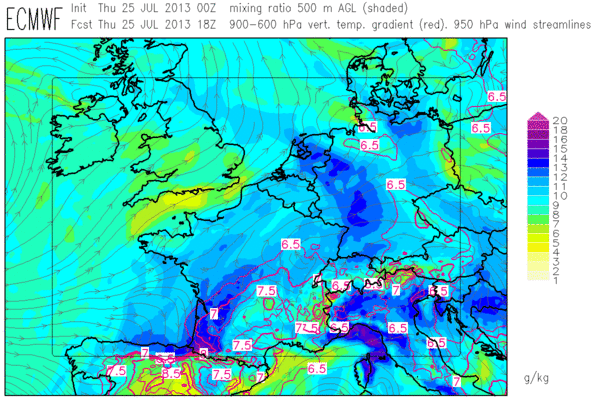
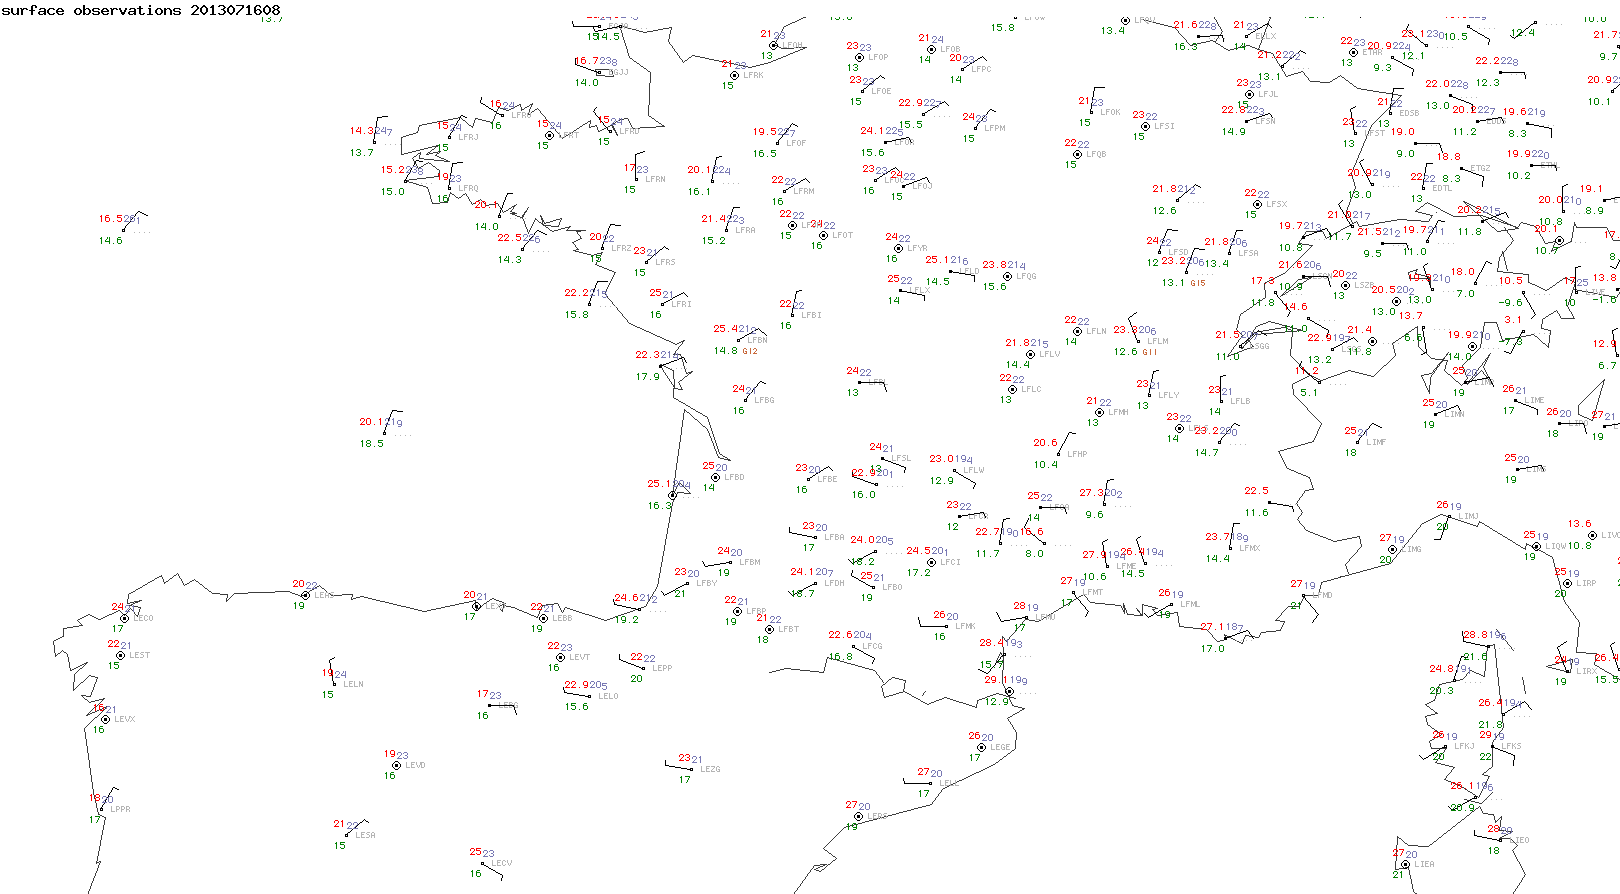
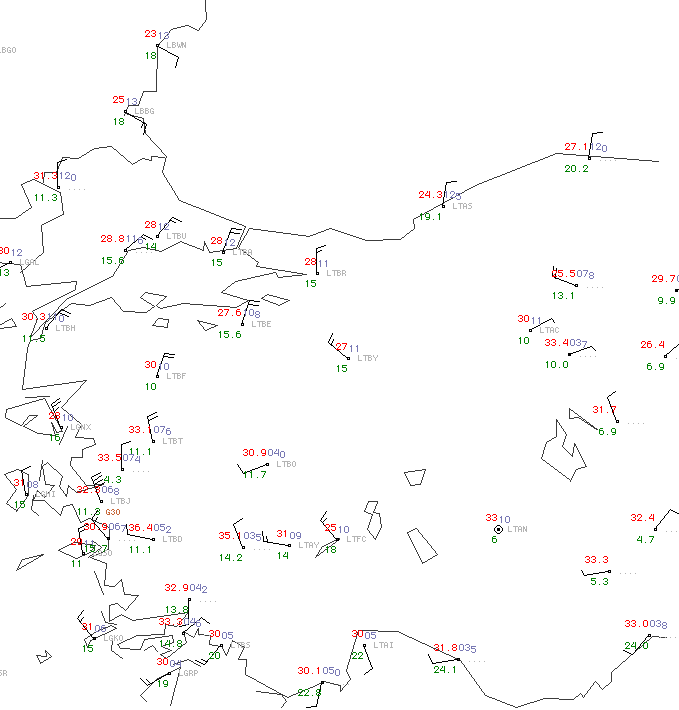
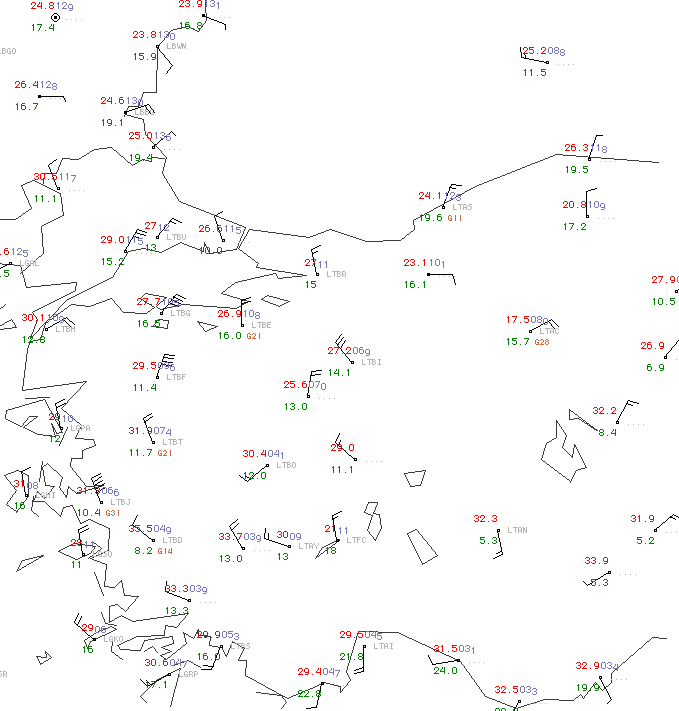
This interpretation was put to the acid test yesterday (Tue 16 July 2013) for the situation prior to the storms over Southern France. The surface map at 08 UTC showed a limited moisture gradient in this area with dew points around 19°C in the foreland of the Pyrenees and around 15°C further North (Fig. 4). The 08 UTC NearCast theta_e field confirmed this moisture gradient also at 778 hPa (Fig. 5). Would daytime mixing indeed act to further decrease the surface dew points to the North, or, conversely, would the reduced daytime mixing (along with further evaporation) manage to maintain the very moist boundary layer over Southermost France?
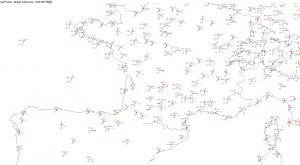
Fig. 4: 08 UTC Tue 16 July 2013 surface map.

Fig. 5: NearCast equivalent-potential temperature at 778 hPa at 08 UTC Tue 16 July 2013.
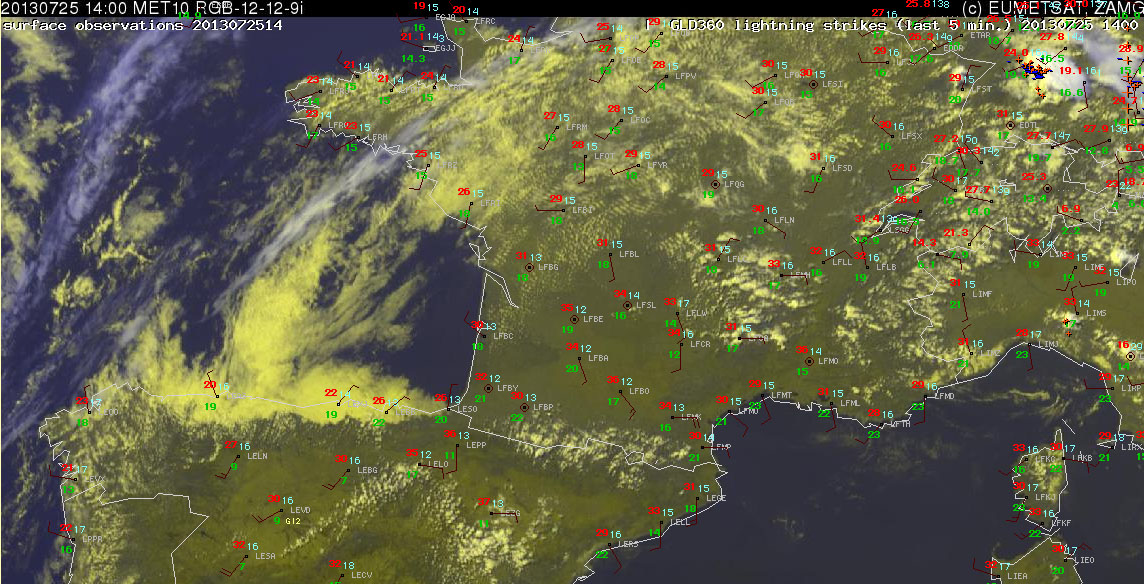
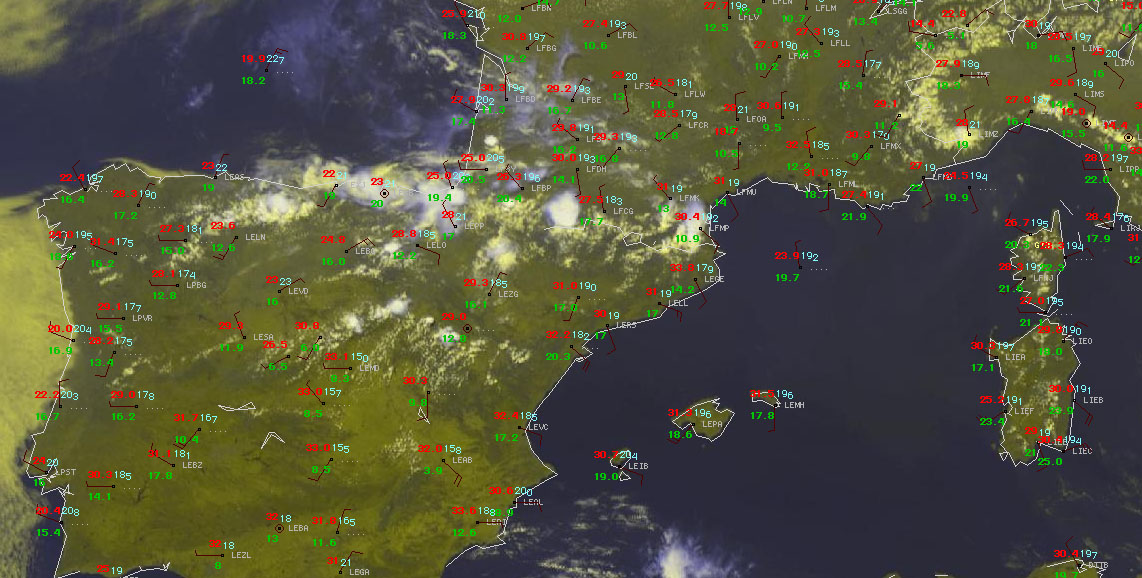
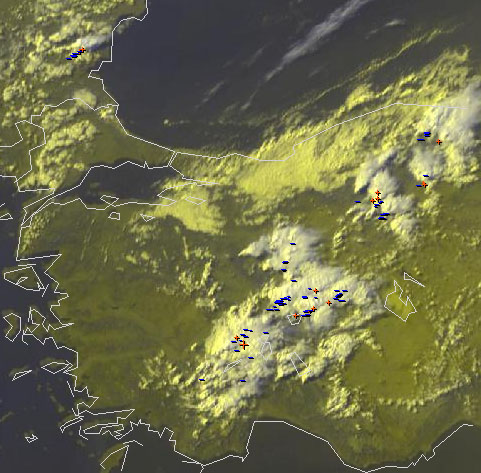
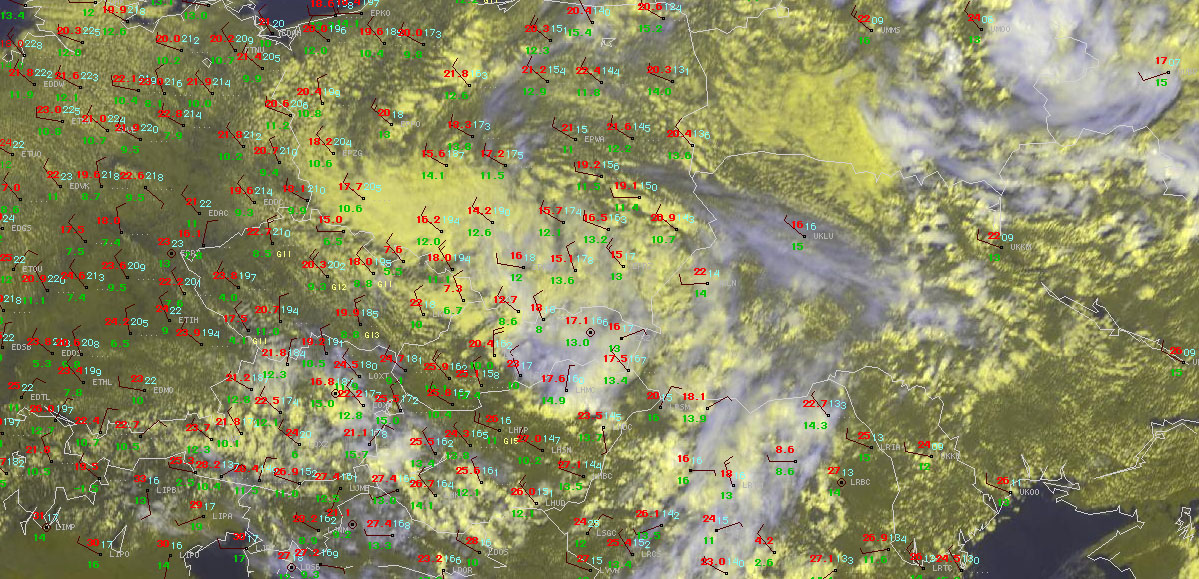
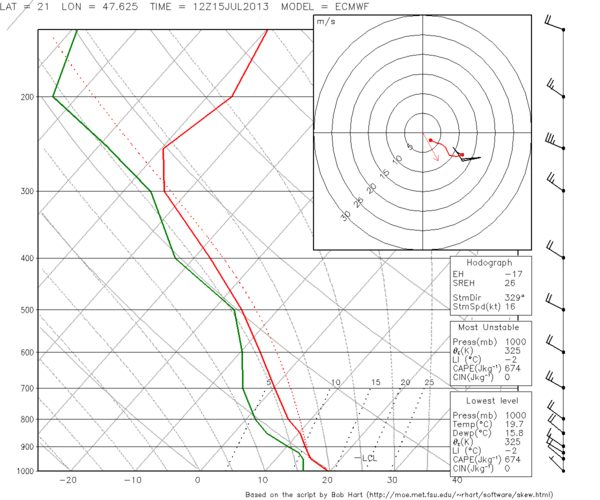
Et voilà, Fig. 6 shows a satellite display and the surface observations four hours later, at 12 UTC. Dew points have indeed lingered around 20°C close to the Pyrenees, where numerous storms were now firing up. On the other hand, they have dropped as low as 11 to 12°C on the other side of this “dryline” from Bordeaux to the Northeast. The 12 UTC Bordeaux sounding confirmed a deep and well-mixed boundary layer, in which the lack of moisture precluded any storm development (Fig. 7).
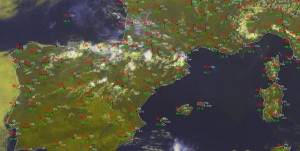
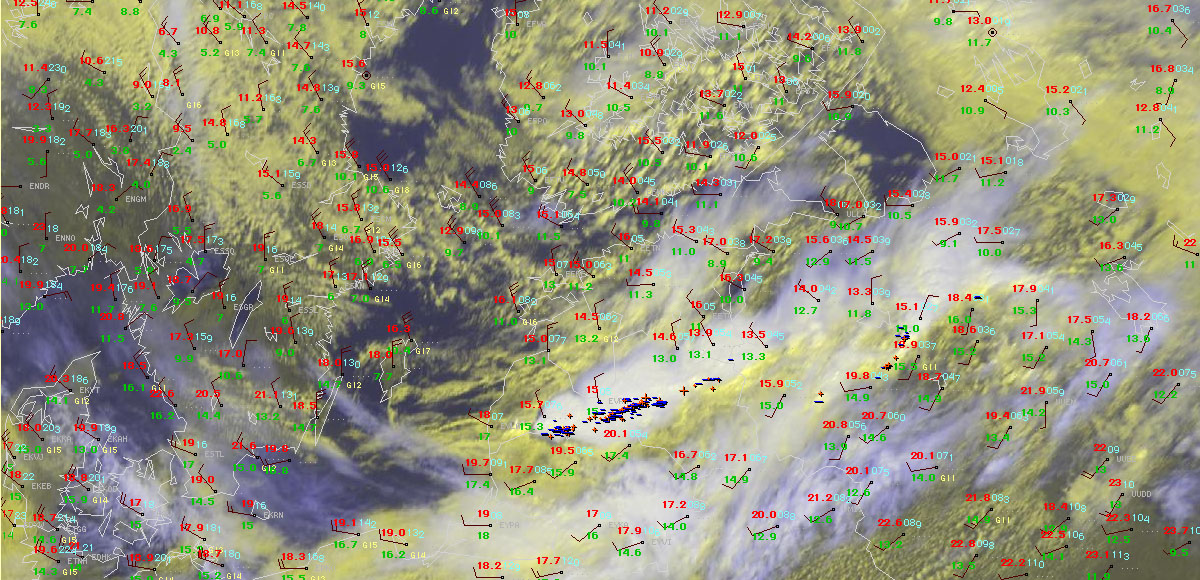
Fig. 6: Nowcast display at 1200 UTC Tue 16 July 2013: Meteosat E-view satellite image and SYNOP observations.
Fig. 7: 12 UTC Tue 16 July 2013 sounding from Bordeaux (France).
In the following hours, numerous pulse storms formed over Southern France with large hail, severe wind gusts and excessive rain in many places. Over Northern Spain, deep-layer shear was slightly enhanced to 15 m/s, which was sufficient for a better storm organization. The most significant storm was a bow echo which brought a 34 m/s wind gust in Miranda de Ebro and extensive hail and wind damage in the La Rioja region nearby.
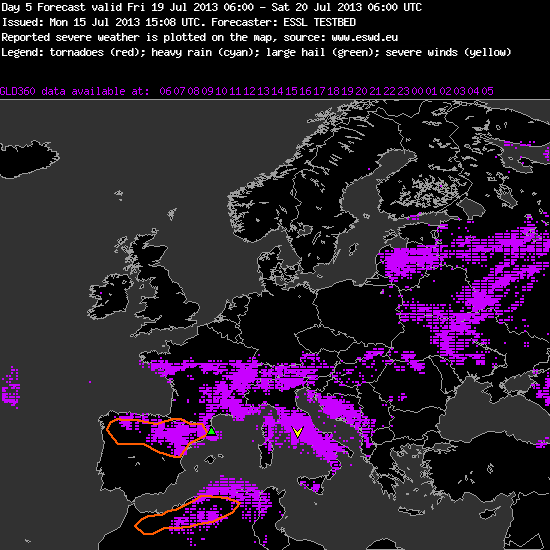
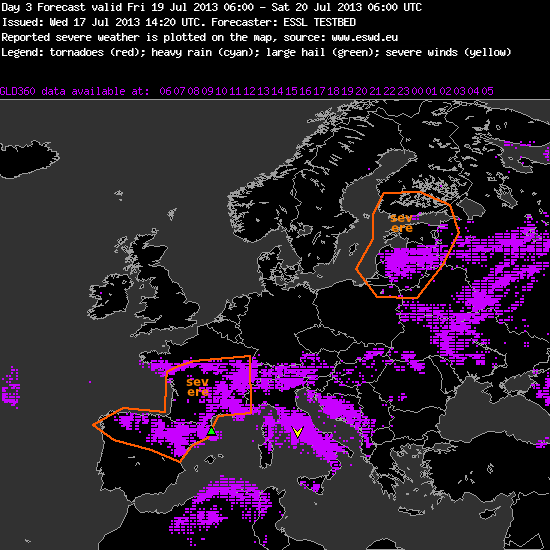
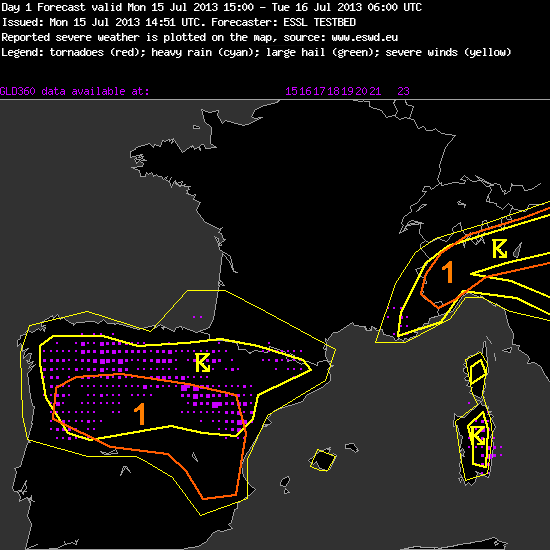
While the forecast models had agreed on convective initiation over Northern Spain, they had been much more reluctant with precipitation signals over Southern France. However, in yesterday’s day 1 forecast we had extended the 50% thunder line and the level 1 well into Southern France, since the observed high dew points and the probably reduced vertical mixing (see above) convinced us of a high CAPE buildup and an explosive release as soon as the outflow boundaries from the Pyrenees would move into the foreland. The other level 1 area in the Western Alps for a chance of excessive rain worked out as well. All in all, we could agree that this was the so far best forecast of the entire Testbed period, which is why it is presented in full detail in Fig. 8. The afternoon nowcasts were equally successful (not shown). And now some champagne, please!

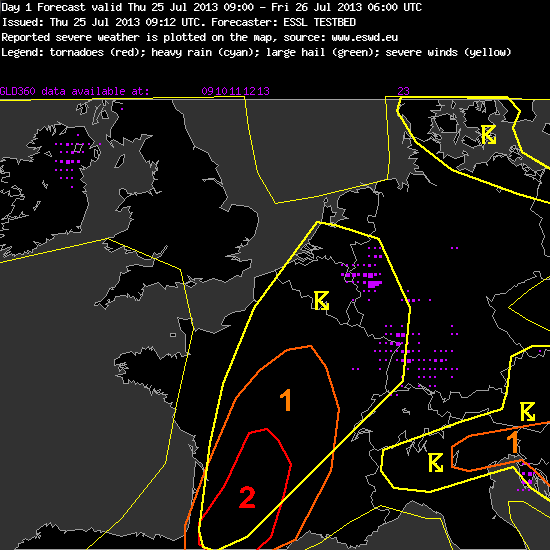
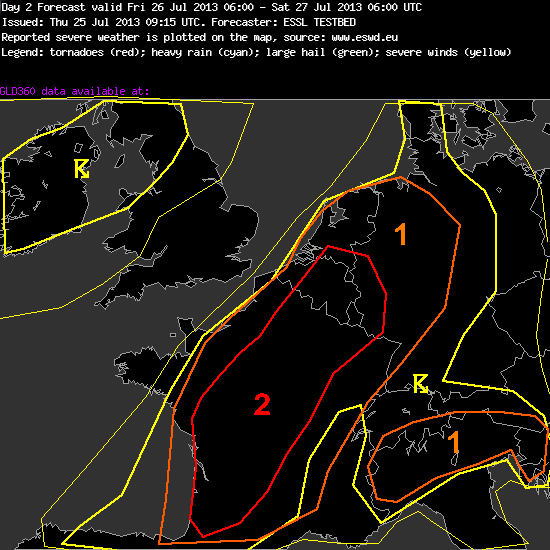
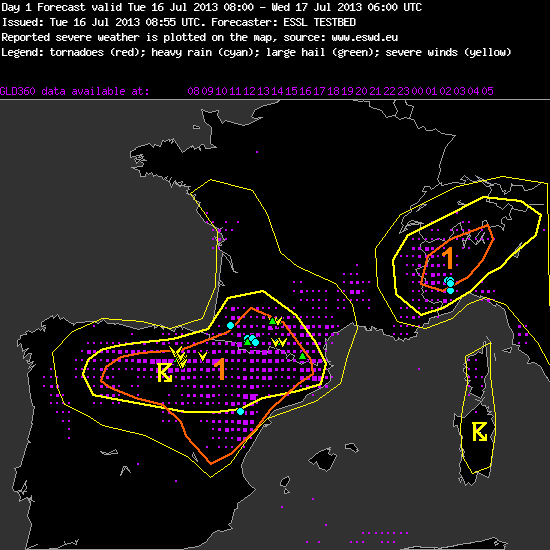
Fig. 8: Verification of the day 1 forecast valid for Tue 16 July 2013.
—–
Day 1 Forecast
Valid: Tue 16 Jul 2013 08:00 to Wed 17 Jul 2013 06:00 UTC
Issued: Tue 16 Jul 2013 08:55
Forecaster: ESSL TESTBED
A level 1 was issued for N and E Spain and s France mainly for large hail and severe wind gusts.
A level 1 was issued for NW Italy mainly for heavy rainfall.
…other comments…
N Spain, S France:
Moderate CAPE (~1000 J/kg) can build where coastal moisture gets advected inland. 0-6 km shear wind shear is below 15 m/s. We expect some pulse storms. The strongest ones may bring localized hail and downbursts.
E Spain:
0-6 km wind shear increases up to 20 m/s further South and a travelling short-wave trough provides some lift, but it is still doubtful if the strong cap can be broken. If storms form, they can organize into strong multicells or isolated supercells with large hail and severe wind gusts.
Western Alps:
We expect afternoon and evening storms in an environment of weak vertical wind shear. CAPE is rather low on the French and Swiss side, but increases to ~1000 J/kg over the Po valley, where surface observations show more low-level moisture (dew points around 19C). With the arrival of a weak short-wave trough, convection can continue into the night hours and may grow into a larger cluster. Heavy precipitation is possible.
—–