Today (Fri 19 July 2013) well-organized thunderstorms occurred on the one hand in the Baltic States, Belarus and the Ukraine, and on the other hand again over parts of Spain and France. Not only the geographic location of these two areas, but also the character of the storms was diametrically opposed to each other.
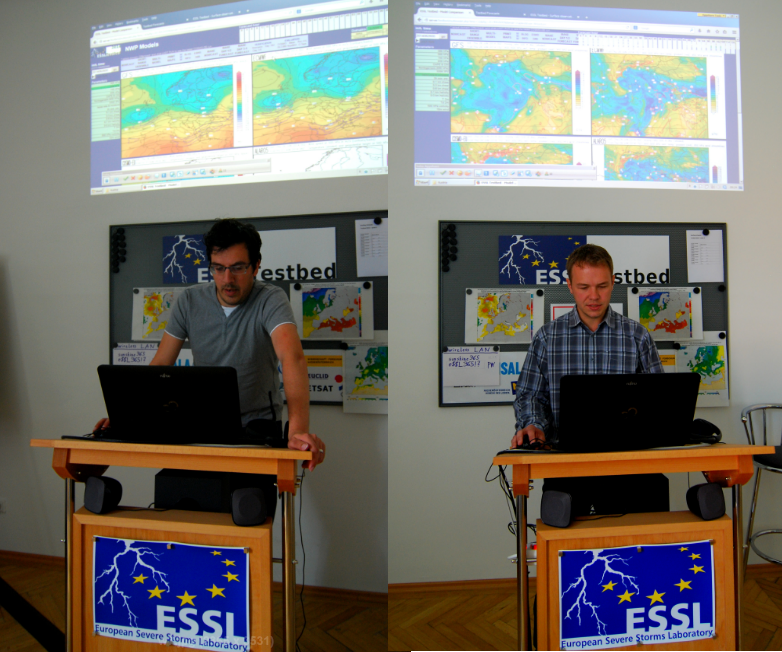
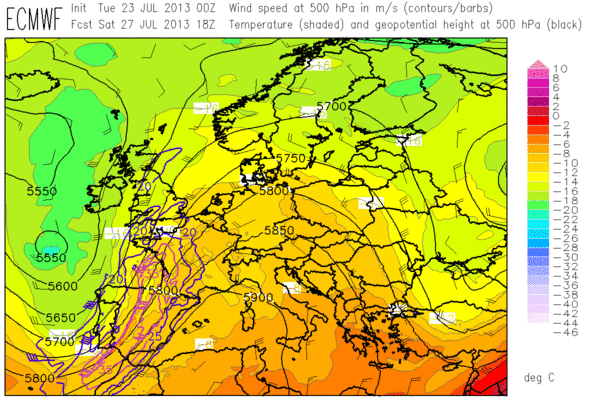
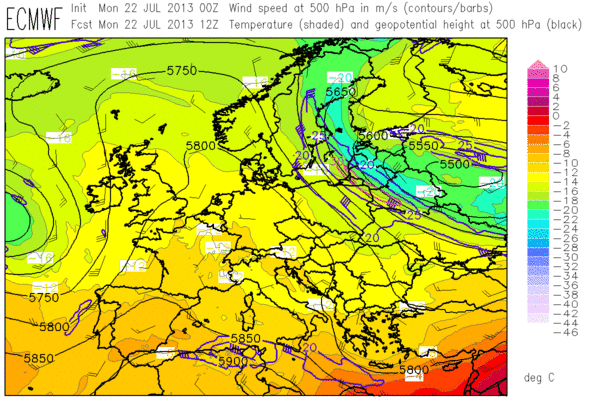
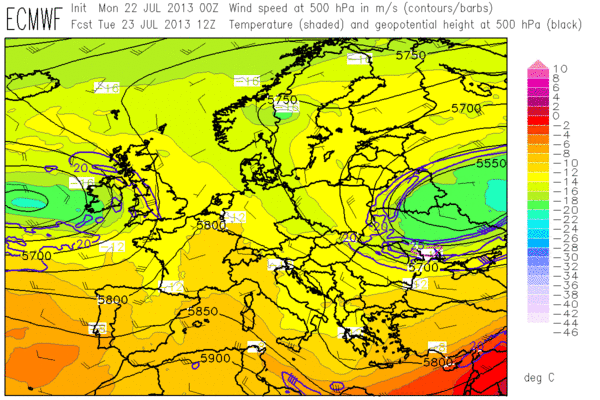
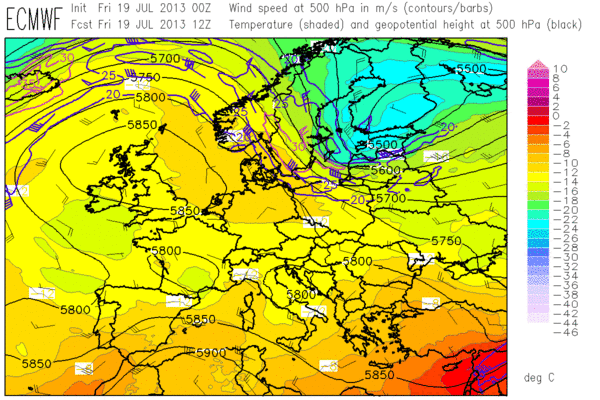
Fig. 1 briefly presents today’s large-scale weather pattern in form of the 500 hPa ECMWF forecast for 12 UTC.

Fig. 1: ECMWF forecast of 500 hPa geopotential (black contour lines), temperature (color shades) and wind (barbs) for 12 UTC Fri 19 July 2013.
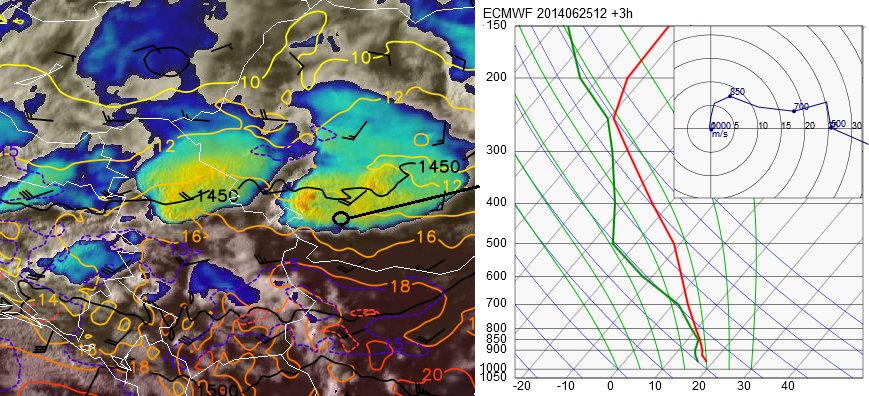
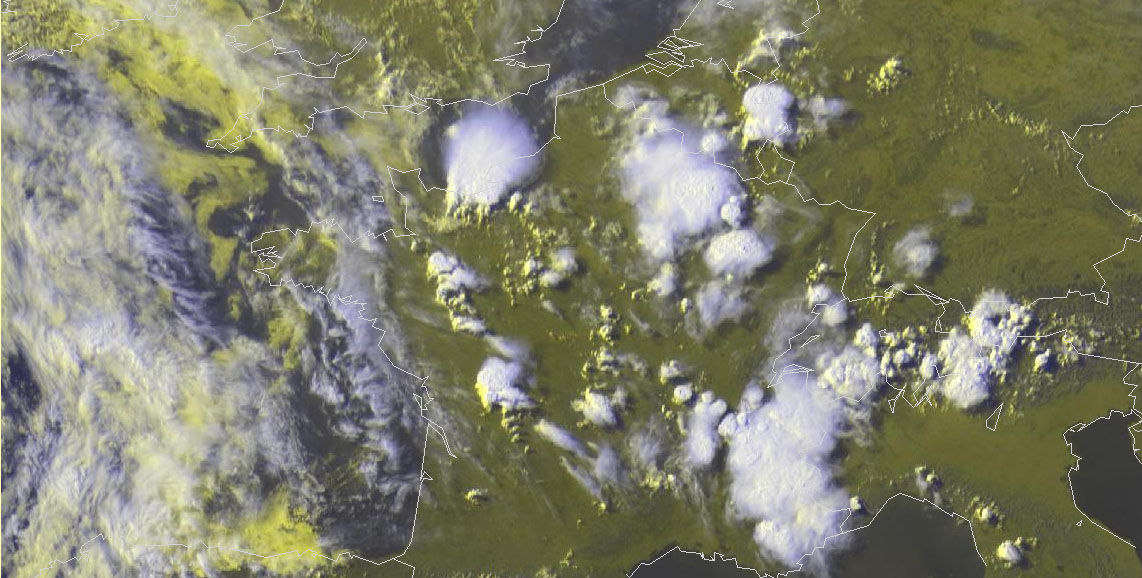
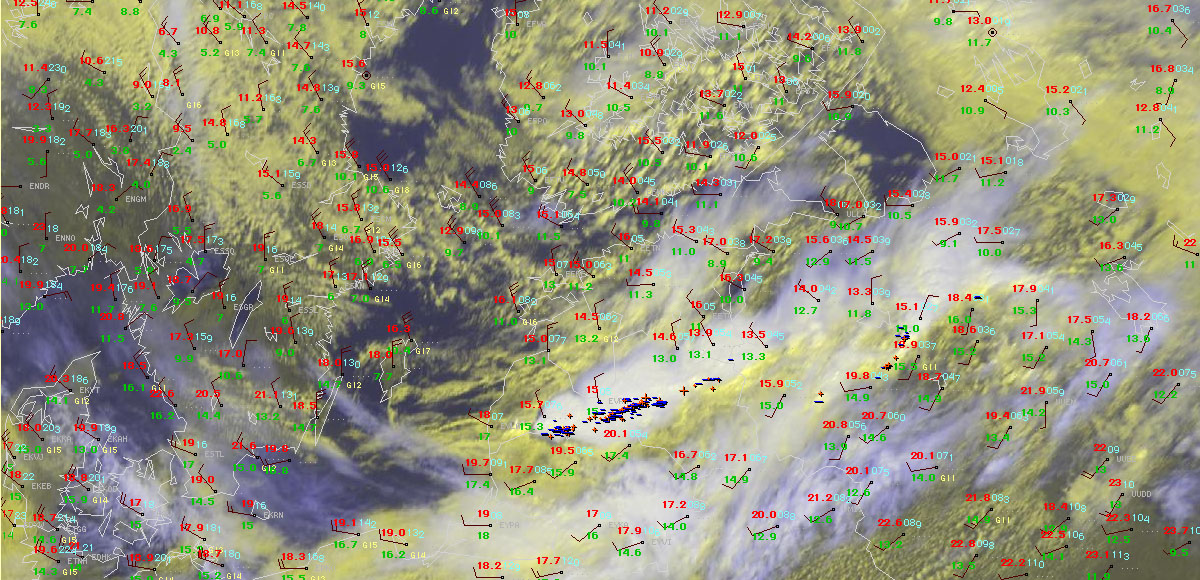
The Spanish and French convection again formed in the vicinity of the shallow but everlasting upper-level low, which provided the familiar environment of moderate to high instability and rather weak (albeit locally enhanced by sea breezes) vertical wind shear. Fig. 2 shows another display of well-organized, powerful storms which have formed over Northern Spain the 11th day in a row.

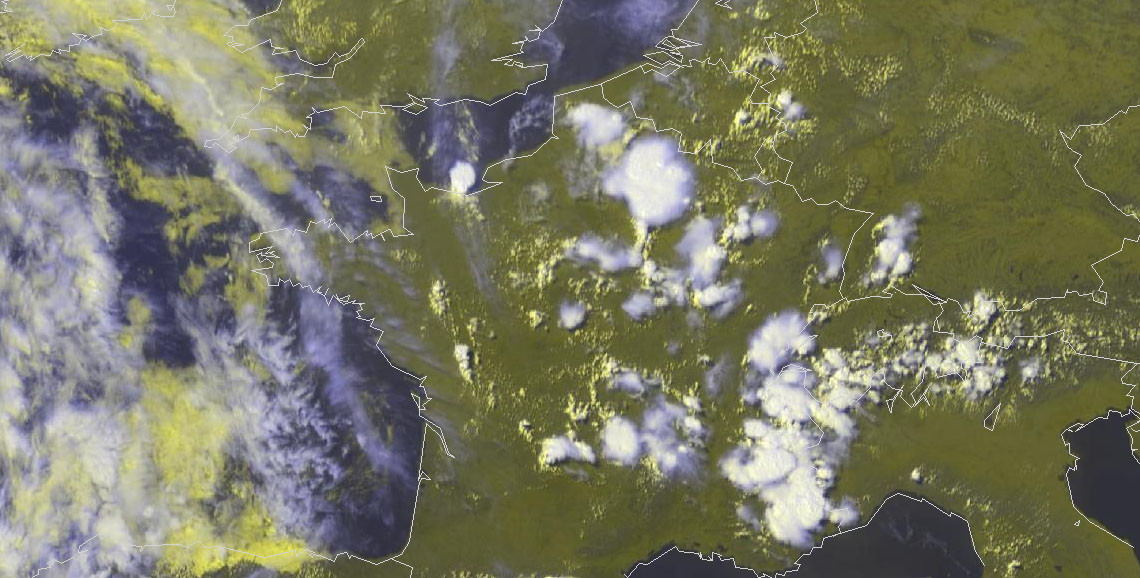
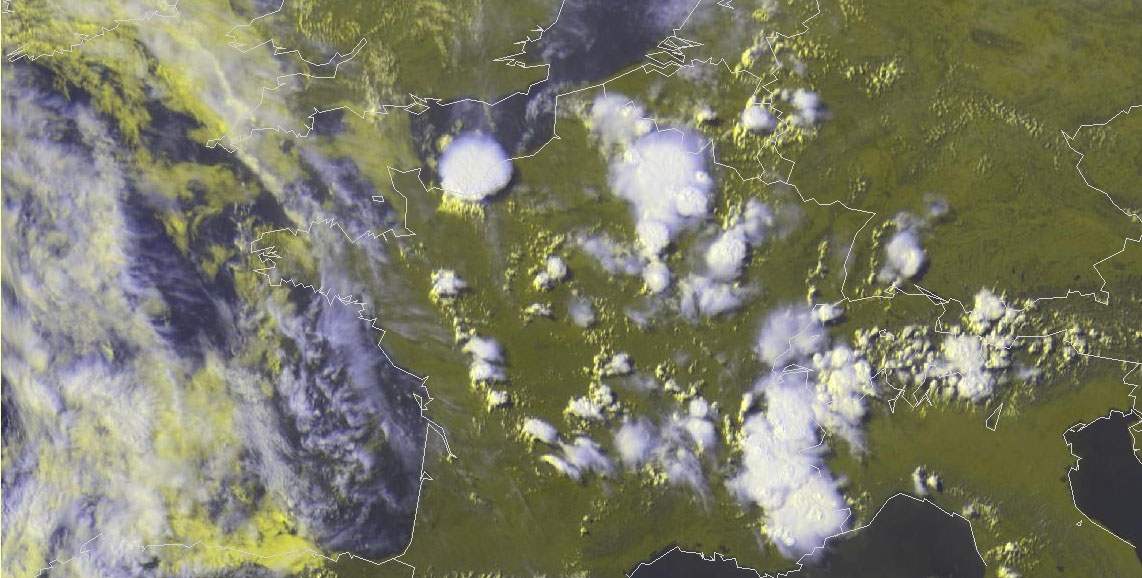
Fig. 2: Nowcast display at 1445 UTC Fri 22 July 2013: Meteosat E-view satellite image lightning detections within the last 15 minutes.
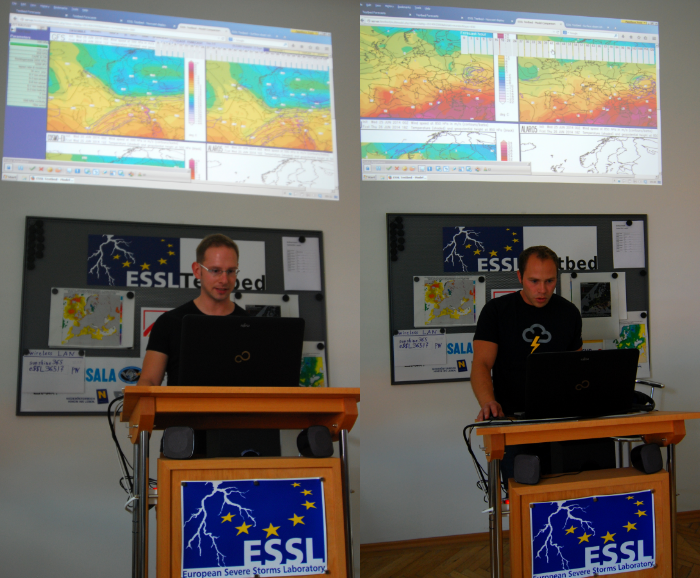
However, the arguably more interesting, because new, convection was the one over Northeastern Europe. As shall be shown below, this new environment of strong shear, strong forcing and limited CAPE provided bigger challenges for the Testbed participants than the x-th round of Spanish storms. Fig. 3 and 4 present the sequence of forecasts targeted on today.
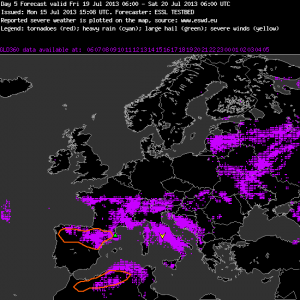
Fig. 3a: Verification of the day 5 forecast issued on Mon 15 July 2013, valid for Fri 19 July 2013.
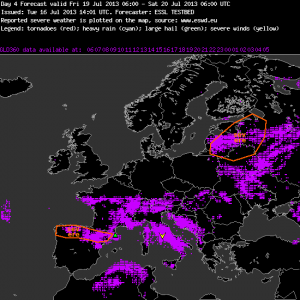
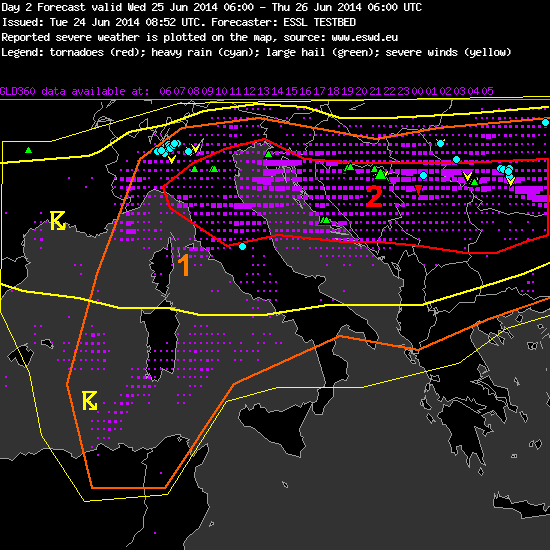
Fig. 3b: Verification of the day 4 forecast issued on Tue 16 July 2013, valid for Fri 19 July 2013.

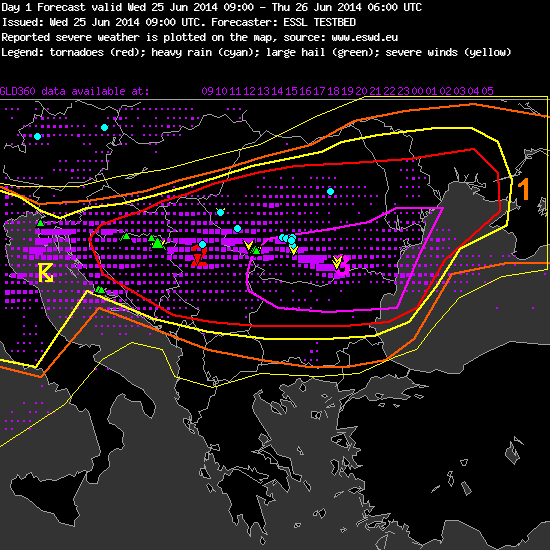
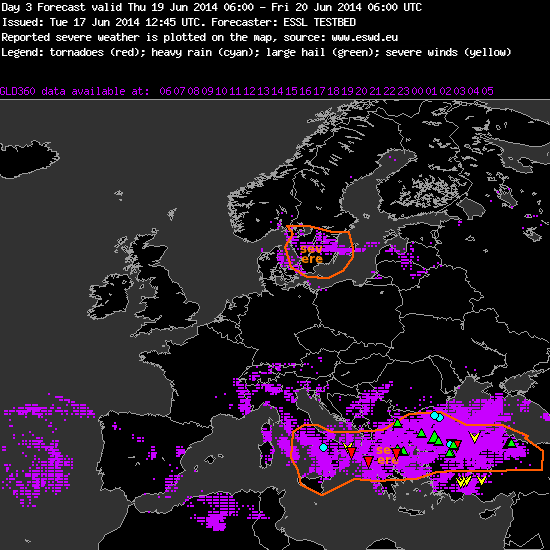
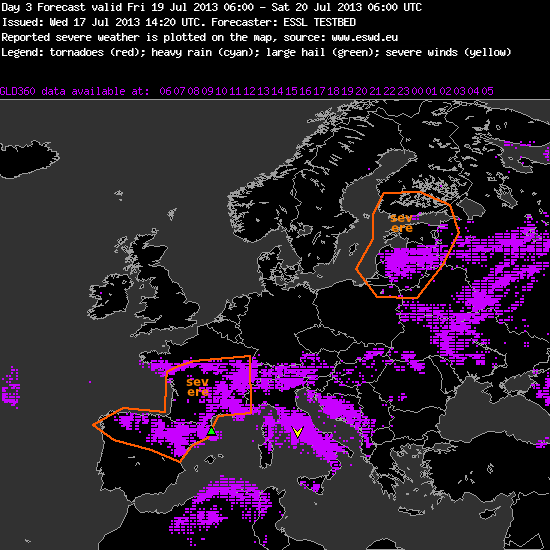
Fig. 3c: Verification of the day 3 forecast issued on Wed 17 July 2013, valid for Fri 19 July 2013.
On Mon 15 July 2013, no threat area was issued yet for today (Fig. 3a). The forecast uncertainty was still too big, as it was also noted in Monday’s blog entry here: “Towards the end of the week, it looks like the active frontal zone over the far North will run another attempt to erupt towards Eastern Europe, but by then discrepancies between GFS (not shown) and ECMWF become quite high and a concurrence with unstably stratified air is still doubtful.”
The first threat area for the Baltic States for today was issued on Tue 16 July 2013 (Fig. 3b), along with the comment: “(…) Low probablilty of severe weather (cold front) – forecasters should keep an eye at this region.”
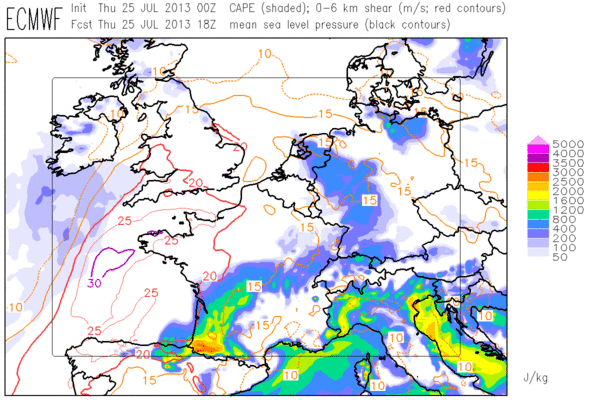
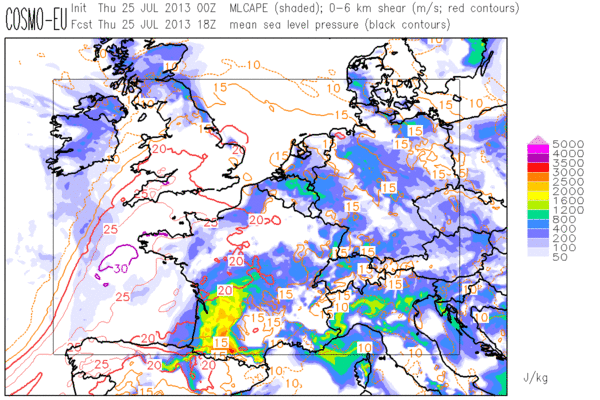
On Wed 17 July 2013, the issued threat area was quite similar (Fig. 3c) but the accompanying text became more assuring: ” (…) A strong PV perturbation moving very quickly from North to South (ECMWF) and NW to SE (GFS) will reach that area around the middle of the day. Large values of 0=6 Km wind shear (up to 20 m/s) are expected over the same area. CAPE values aorund 800 J/Kg over Lithuania and Latvia (ECMWF) or 1200 J/Kg over Lithuania and Western Russia (GFS).”
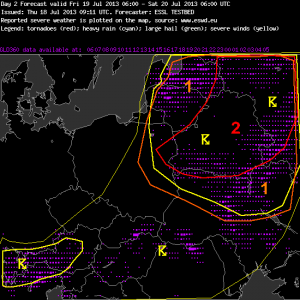
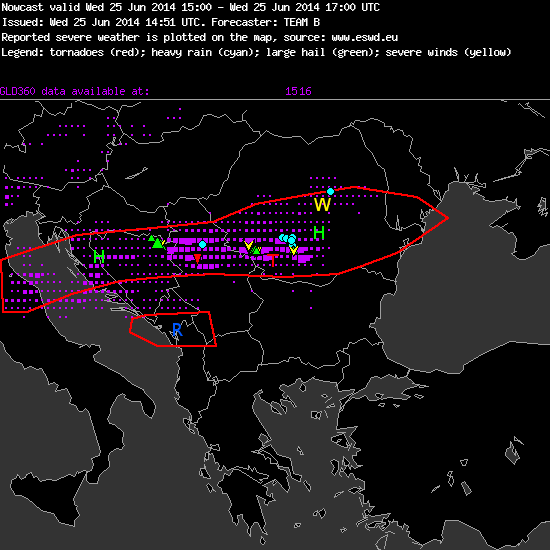
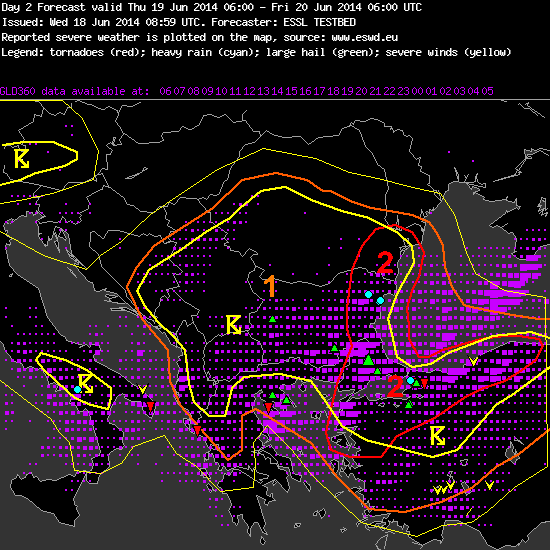
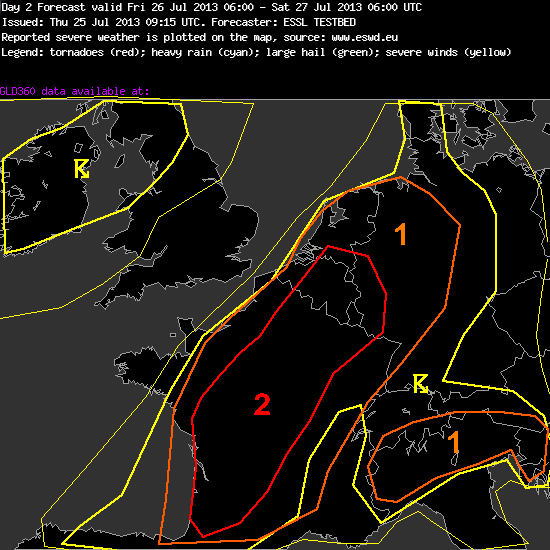
Fig. 4a: Verification of the day 2 forecast issued on Thu 18 July 2013, valid for Fri 19 July 2013.

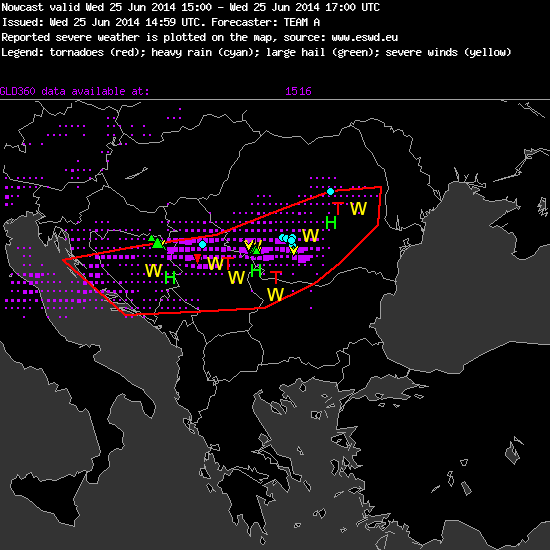
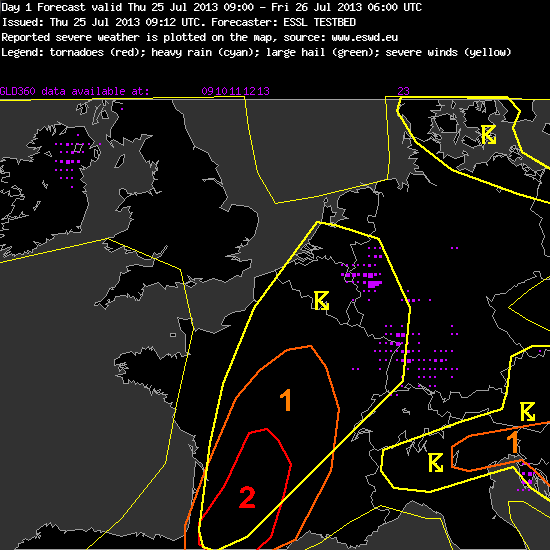
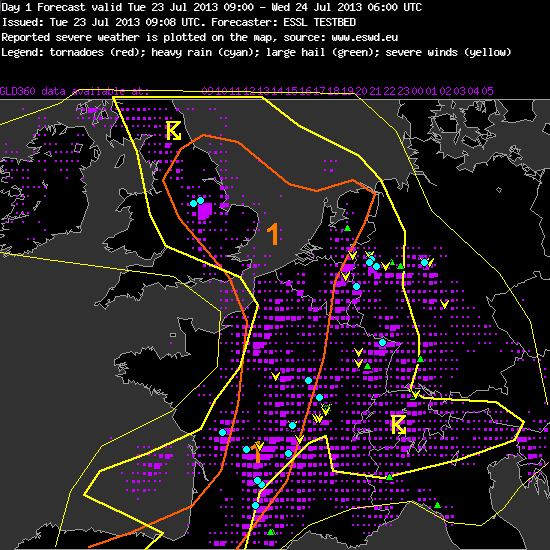
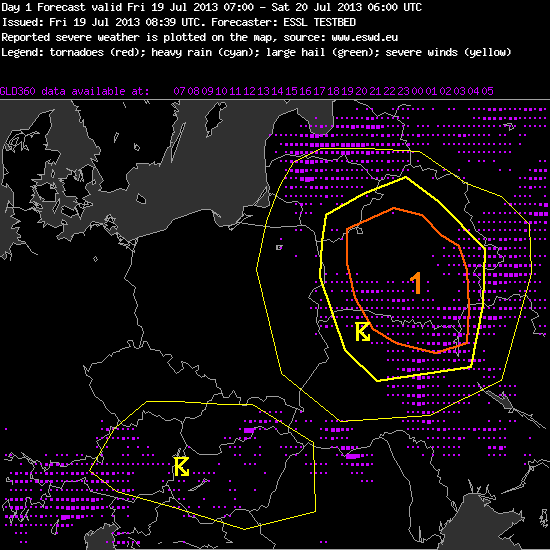
Fig. 4b: Verification of the day 1 forecast issued on Fri 19 July 2013.
For the day 2 and day 1 forecasts targeted on today (Fri 19 July 2013), respectively, the Warsaw subdomain was chosen. The day 2 team on Thursday was confident enough to issue a (low-end) level 2 area centered over Belarus (Fig. 4a) along with the following text:
“A strong through is approaching from Scandinavia. At the eastern side of the through warm and moist air with steepening laps rates will be advected. This will lead to some CAPE around 800 J/kg. During the day and in the night a well definded cold front will cross the northeastern parts of the forecast area at the left exit reagion of a strong upper level jet. With the approaching cold front DLS will increase to values around 15 – 20 m/s. At the coldfront modells predict wide spread convection which will likely developing into a line because of the good environmental shear. At the line widespread severe wind gust and isolated large hail are possible. At evening hours LLS will also increas to values around 10 m/s. The stronger LLS and low LCL will support the chance for tornadoes in some embedded supercells, mostly in the level 2 area. Therefore a low end level 2 was issued.
A head of the coldfront some well organized multicells and some supercells could develop in a weak convergent flow. The main threat would be large hail and isolated downbursts.”
While the confidence in severe thunderstorms had increased from day to day so far, today’s (Fri 19 July 2013) day 1 team performed a break and merely issued a level 1 for Belarus (Fig. 4b) and the following text:
“High probability of thunderstorms during the afternoon and early evening. Strong synoptic forcing is expected over the area with values of CAPE around 500 J/Kg but wind shear around 15-20 m/s in 0-6 Km, 10-15 in 0-3 Km and around 10 m/s in 0-1 Km. Toghether with the arrival of the cold front to the area a low level convergence line will appear.”
Scanning the sequence of reasoning issued along with the forecasts gives the impression that little doubt was left about strong vertical wind shear and strong forcing, but that the amount of instability (expressed in terms of CAPE) became doubtful the closer the event came. In particular, low- to mid-level lapse rates did not seem to be too steep, which did not allow higher CAPE formation. The other “ingredient” for CAPE, enough low-level moisture, seemed to have been in place.
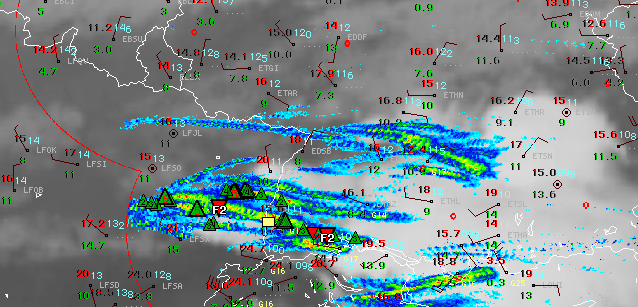
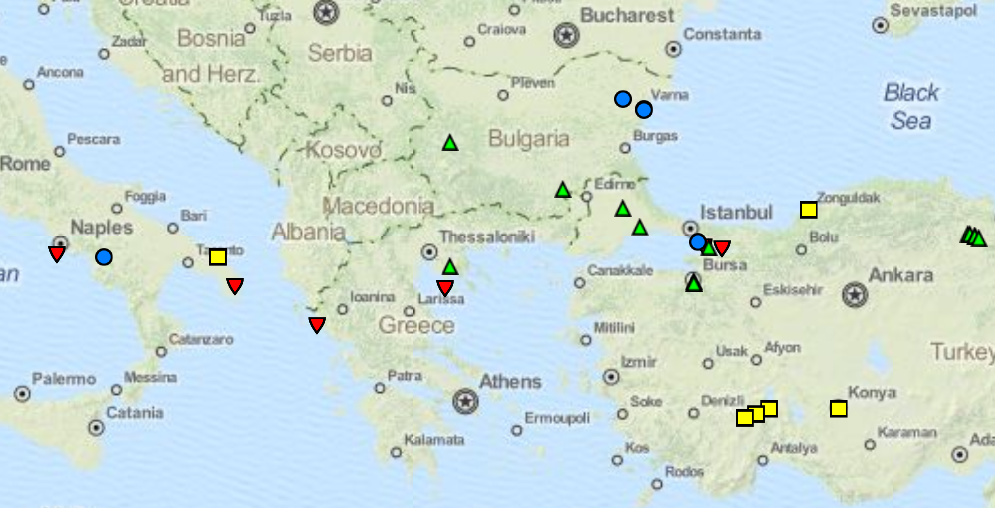
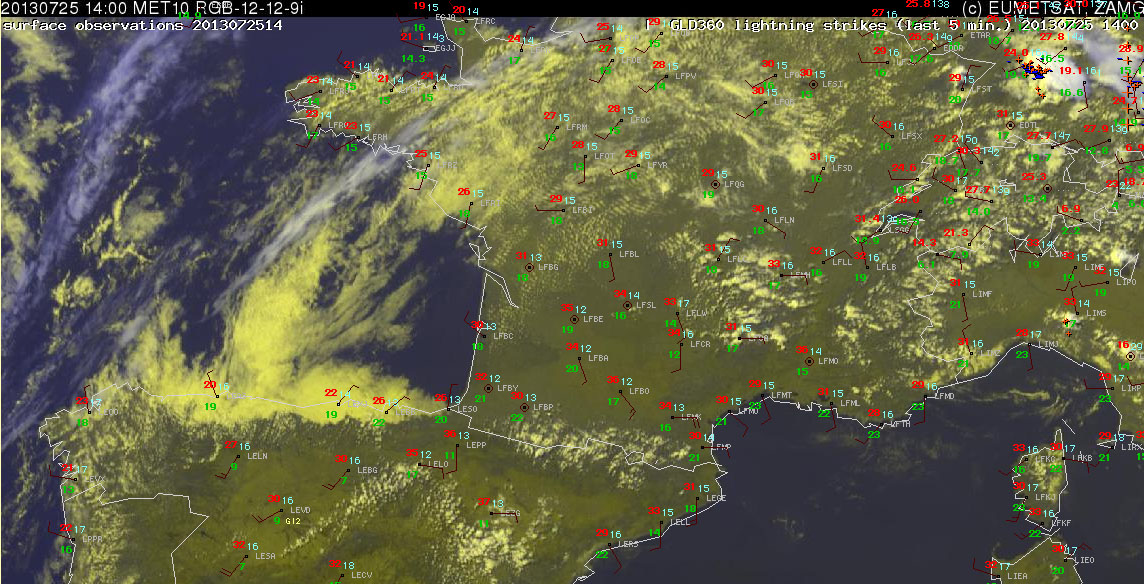
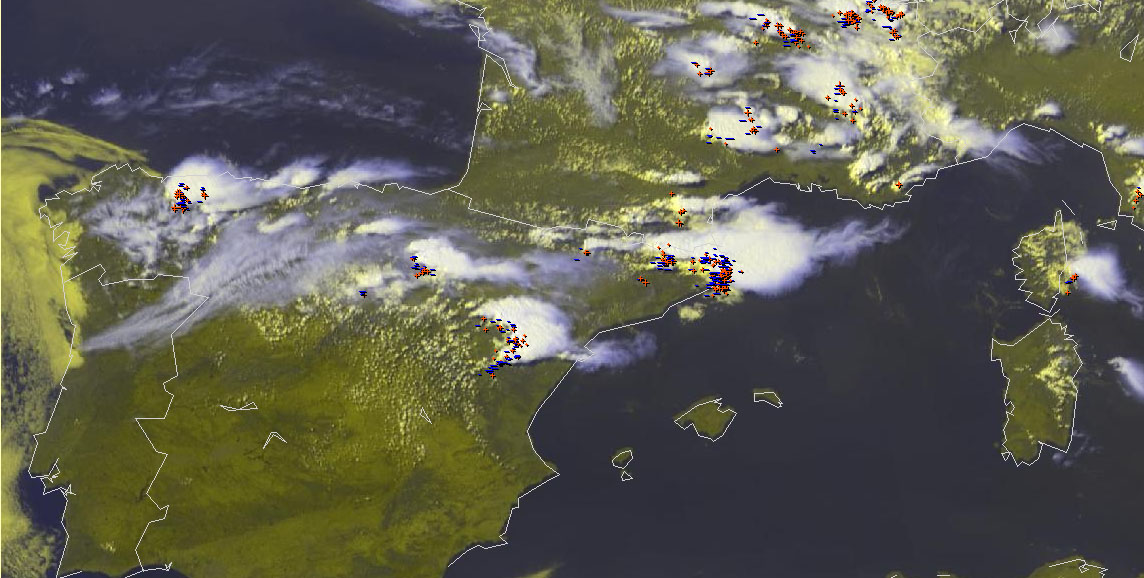
Another reason for the lower confidence in severe weather on day 1 was that the forecast models kept accelerating the cold front. Indeed, a convective line formed already early in the day across Latvia and Lithuania, which was accompanied by a pronounced wind shift (Fig. 5). This rapid development even made us issue an unscheduled nowcast with a wind watch valid from 09 till 11 UTC for areas ahead of the convective line (not shown).
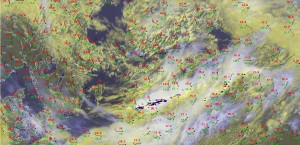
Fig. 5: Nowcast display at 0900 UTC Fri 19 July 2013: Meteosat E-View satellite image, SYNOP reports and lightning detections within the last 15 minutes.
As the line continued to move southeastward into Belarus in the afternoon, it kept its sharpness but the lightning activity got increasingly isolated. Indeed it seems like a lack of instability and the resulting too low cloud tops were the limiting factor here for a better shear consumption.
Till the time of writing, no severe weather reports arrived. The SYNOP gust reports were mostly in the 12 to 15 m/s range, hence an isolated severe gust (>25 m/s) could not be ruled out but should be considered quite unlikely.
While it was therefore a good choice for today’s day 1 team to only issue a level 1 instead of a level 2, the lightning verification showed that quite a lot of storms occurred outside the drawn areas (Fig. 4b). The team on duty seemed to focus too strongly on the main area of interest, something that even experienced forecasters are not immune against. Or was the approaching weekend already too close? 😉
We wish the participants of the third Testbed week a safe trip home and the participants of the fourth and last week a safe journey to Wiener Neustadt!