Thu 4 July 2013: verification issues (or: how rotten can your banana be?)

Today’s post wants to unfurl predictability issues associated with yesterday’s (Wed 3 July 2013) interesting storms, which turned out to be more severe than expected. Thunderstorm activity was associated with a cold front that slowly moved across the Munich domain from the West. Vertical wind shear was weak, and so was the large-scale forcing, as a short-wave trough dived into the Central Mediterranean region instead of overspreading the area of interest. However, a belt of low to moderate CAPE and strong convergence along the front line were sufficient to trigger widespread thunderstorms across Austria, Bohemia and E Germany (see yesterday’s post for a brief outline), which did not only bring the expected heavy rain and marginally large hail events, but also a surprising number of severe wind gusts.

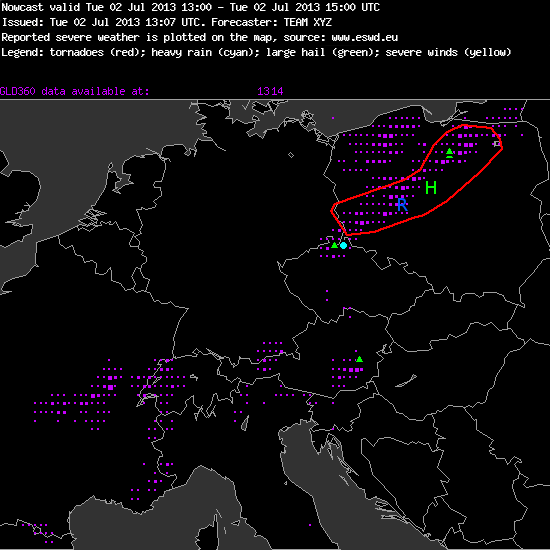
[In all of the following pictures, the thin yellow line is the >15% thunder probability forecast, the thick yellow line is the >50% thunder probability forecast, and the orange line is the 5-15% severe weather probability (“level 1”). The probability numbers refer to a 40 km radius around a given point. From the verification side, magenta dots illustrate the lightning detections, green triangles the large hail reports, yellow V’s the severe wind reports, and blue circles the heavy rain reports.]

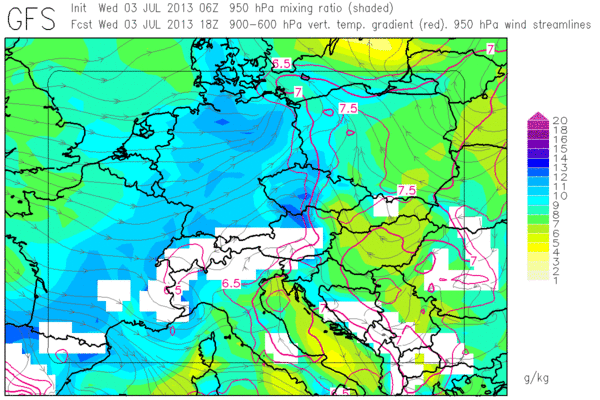
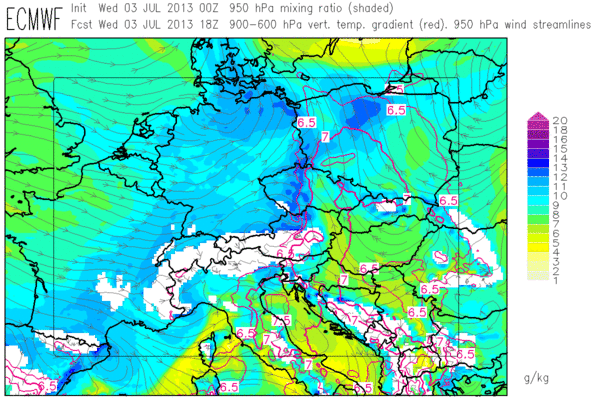
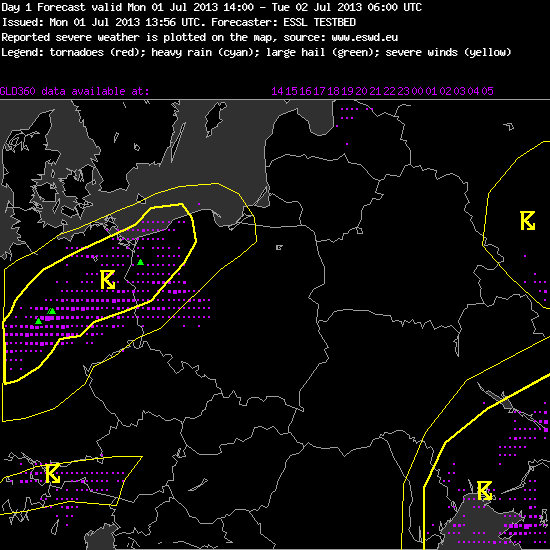
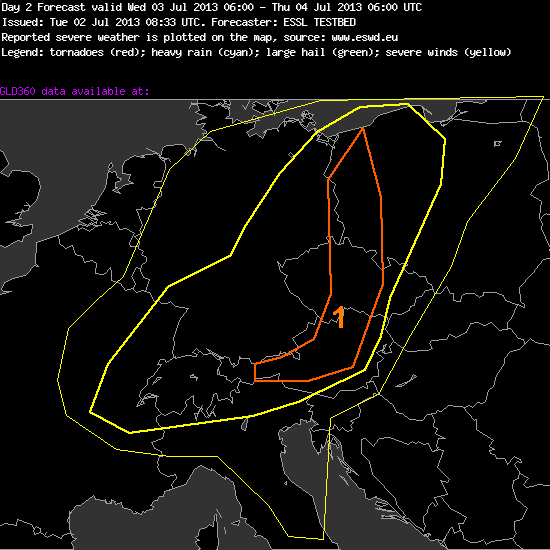
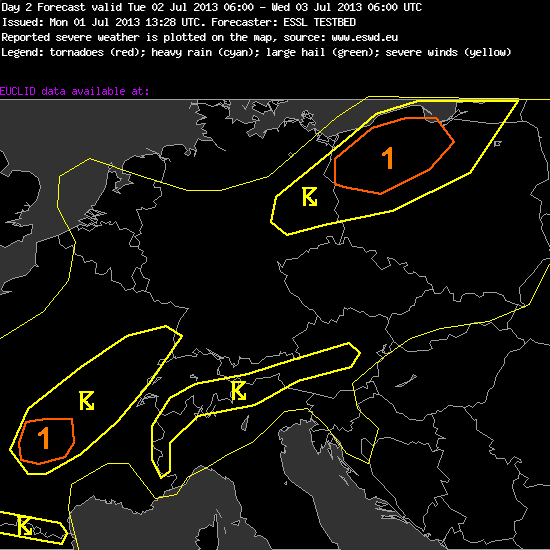
Fig. 1 shows the day 3 forecast for the target day, issued on Monday, which was already quite accurate.  The day 2 forecast (Fig. 2) managed to even narrow down the level 1 area in Austria and the Czech Republic, but missed the German events.  Interestingly, the day 1 forecast (Fig. 3) was less confident and broadened the level 1 area again. This perceived increase in uncertainty resulted from an observed discrepancy between the model forecasts, which placed the belt of maximum CAPE (and the highest precipitation signals in the afternoon) along the German/Austrian and German/Czech border, and the latest surface observations, which showed the axis of best low-level moisture with dew points up to 17°C about 200 km further East. The applied “correction” of the model forecasts worked out well in Austria but was increasingly counterproductive further North, where the German events were missed and the forecasted events over Poland did not happen.

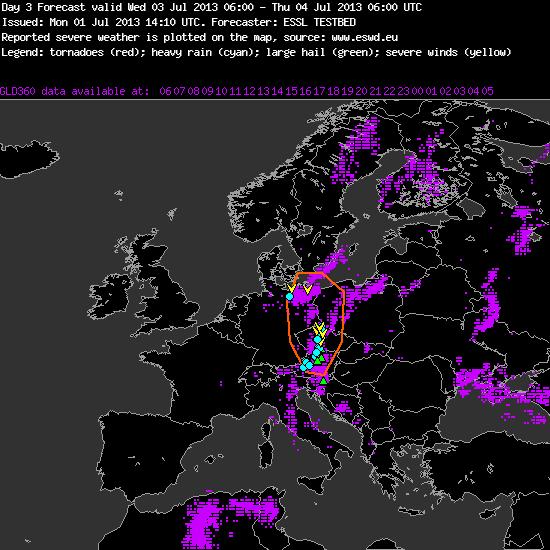
Fig. 1: Verification of the day 3 forecast for Wed 3 July 2013, issued on Monday.

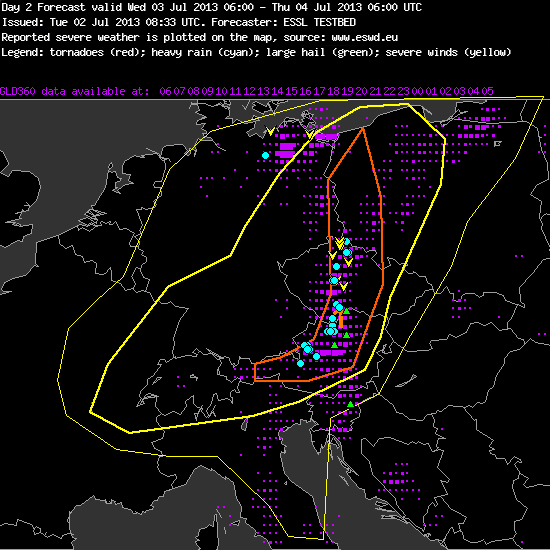
Fig. 2: Verification of the day 2 forecast for Wed 3 July 2013, issued on Tuesday.

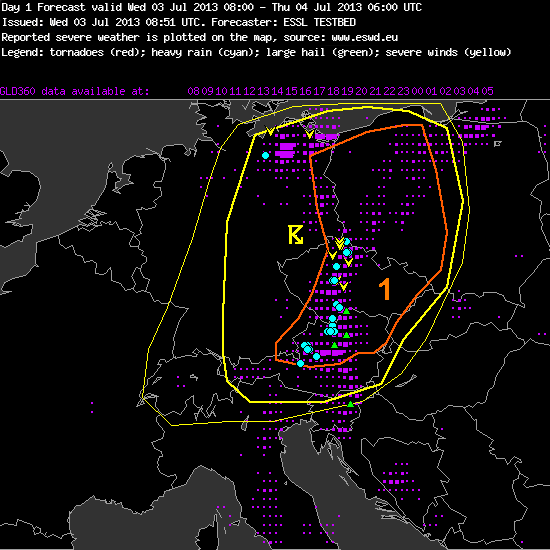
Fig. 3: Verification of the day 1 forecast for Wed 3 July 2013, issued on Wednesday morning.

The verification scheme was also lively discussed in today’s verification session, when not even half of Wednesday’s ESWD reports had arrived yet (in particular, all but one wind reports were still missing), and when much of the level 1 area still looked quite empty. A how high coverage of severe weather events would justify a level 1 at all? Or, in Tomas’ words: how much of our “level 1 banana” in Fig. 2 and 3 should be “good” and how much could be “bad” in order to make the whole banana still “good”? The probabilities listed further up in this post, including the 5-15% severe weather probability as our level 1 criterion, refer to a radius of 40 km around a given point, which roughly covers the range of a thunderstorm’s audibility. So a level 1 over this given point can more easily be interpreted as a 5-15% chance that a thunderstorm turns severe within earshot. This implies: if you draw a 40 km radius around each individual severe weather report and the resulting envelope area covers between 5 and 15% of your level 1, your forecast was well calibrated. During the verification session this morning, it was finally agreed that the Southern part of the level 1 area was fine but the Northern part over Poland was a false alarm. With the lot of new severe weather reports which have arrived in the course of today, it now even looks like the Southern part may have deserved a level 2, meaning a >15% probability of severe weather within 40 km of a given point.

While a risk of heavy rain and of marginally large hail (note: each of the hail reported to ESWD was only 2 cm in size) was well forecasted, the number of severe wind events was quite surprising. Two things struck us in the 12 UTC soundings (Fig. 4) when we searched for possible reasons:

(1) The Vienna sounding (though situated a bit further to the East) showed very dry layers of air around 800 hPa, which could – together with the Southwesterly flow at this level – be interpreted as a result of subsidence in the wake of the Alps. These dry layers, given that they spread over Northern Austria and parts of the Czech Republic, could have been a reason to enhance evaporative cooling and increase the gust potential. This explanation, of course, does not hold for the severe wind events in NE Germany, far away from any mountains.

(2) The glance at 0-6 km vertical wind shear may have been misleading, since the 12 UTC soundings from Lindenberg, Prague and Vienna uniformly showed that the 0-3 km shear was even higher than the 0-6 km shear along with nice veering, which may have  been marginally supportive of a better storm organization with an attendant higher threat of severe wind gusts.

Fig. 4a

Fig. 4a

Fig. 4b

Fig. 4c.

Fig. 4c.

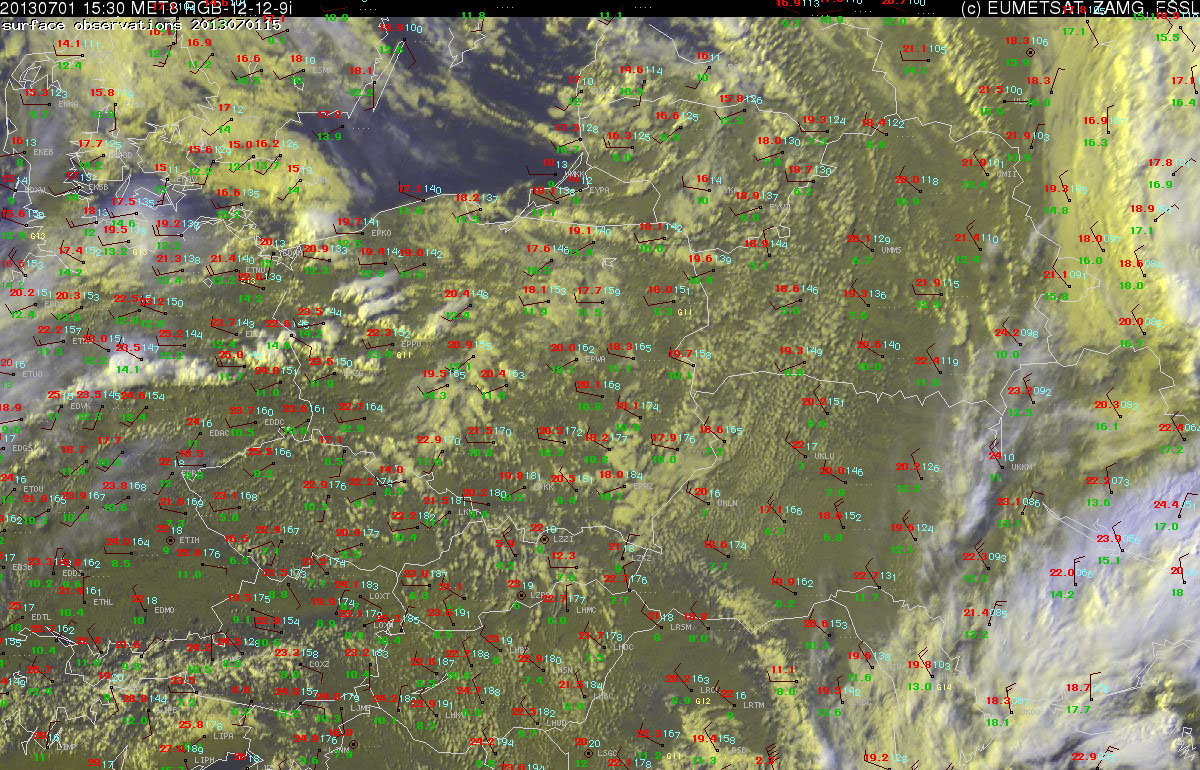
The most interesting storm concerning this matter was the Southeasternmost storm over the Czech Republic, which can be seen in Fig. 5, a recycle of the 1355 UTC nowcast snapshot already included in yesterday’s post. This storm showed the highest radar reflectivity and started to move Southeastward (!) into Austria soon after this snapshot. It kept its highly deviant motion for one and a half hours, which meant that it could savour on particularly rich inflow of Southeasterly near-surface winds and on even higher storm-relative helicity. It can be concluded that this “storm of the day” was at least a strongly propagating multicell or possibly even a supercell. At 15 UTC it hit Litschau at the Czech/Austrian border with plenty of (rather small) hail, 21 mm precipitation within 20 minutes, a maximum gust of 65 km/h and a temperature drop from 25 to 14°C, before it clustered with the rest of the Austrian storms while all of them started to weaken. This case is another reminder that mesoscale processes (especially over structured terrain like in many parts of Europe) can favourably modify the conditions for better organized storms even if the large-scale setup looks inconspicuous.

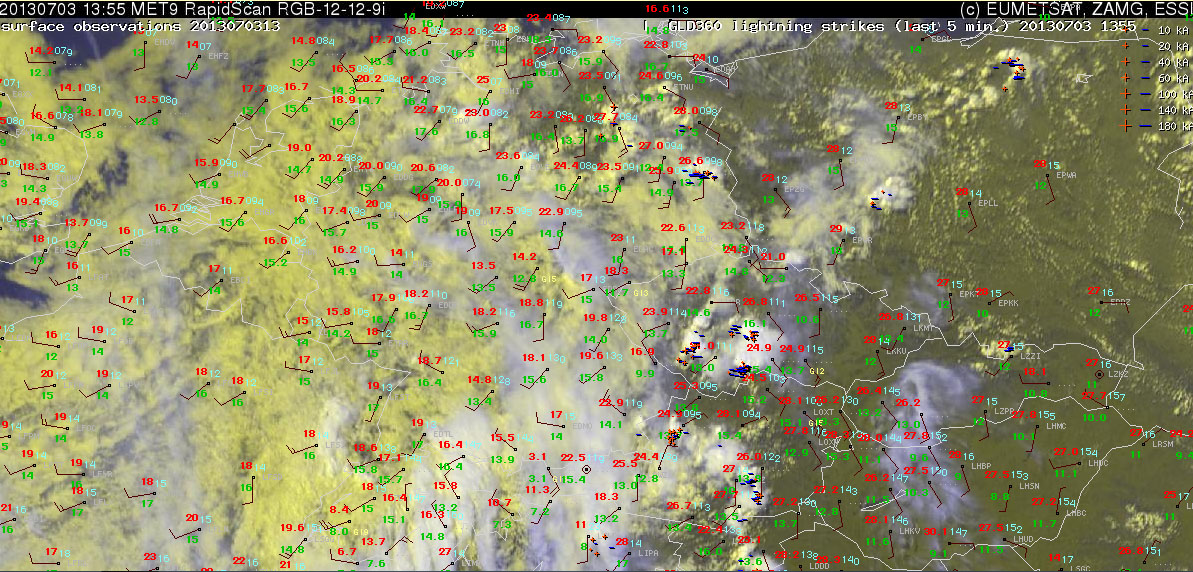
Fig. 5: Nowcast display at 1355 UTC Wed 3 July 2013: Meteosat E-View satellite image, latest SYNOP reports (13 UTC) and lightning detections within the last 5 minutes.

The Testbed participants enjoyed the well-deserved joint dinner tonight. Five of us ended up in Clumsy’s Pub afterwards, where we added a new meaning to its name by playing a small table soccer tournament (until we ran out of coins). It was another clear and pleasant summer evening in Wiener Neustadt. The Alpine storms can be well observed from here each afternoon, but tomorrow is the last and only remaining chance during this first Testbed week for a stray thunderstorm to hit us on-site.

Share

Wed 3 July 2013: heavy rain threat with a slow-moving cold front in the Munich domain

More and more routine can be felt with the activities on the third day of the Testbed. Neither the huge amount of available data nor the equally huge Schnitzels at the nearby lunch restaurant are as intimidating any more as they were on the first day.

Since the weather pattern for the next days does not look too promising (hardly any dynamics across the continent will only allow for weakly organized thunderstorms), the nowcasting was today’s most interesting part. As already outlined in yesterday’s post, a weak cold front was entering the Munich domain from the West and provided a trigger mechanism for convection. However, the belt of forecast CAPE along the cold front was quite narrow, as the area with the steepest lapse rates which had brought us yesterday’s vivid storms was forecasted to depart to the East ahead of the best low-level moisture (Fig. 1). It was hence expected that thunderstorm activity would mostly be tied to the front line over parts of Poland, the Czech Republic, E Germany and Austria. A level 1 risk was issued for these areas in the day 1 forecast (confirming the previous day’s day 2 forecast) mainly for a heavy rain risk due to a slow and almost front-parallel storm motion, and secondarily for large hail with more isolated, prefrontal storms which could still benefit from the steeper lapse rates and less competition.

Fig. 1: GFS (top) and ECMWF forecasts for low-level moisture (color shades) and lapse rates (red contour lines, plotted above 6.5 K/km) for 18 UTC Wed 3 Jul 2013.

Fig. 1: GFS (top) and ECMWF forecasts of low-level moisture (colour shades) and mid-level lapse rates (red contour lines, plotted above 6.5 K/km) for 18 UTC Wed 3 Jul 2013.

This forecast implied that the behaviour of the low-level moisture and wind field had to be closely monitored throughout the day. Fig. 2 shows the situation at 1355 UTC, which was the latest data available for the 14 UTC nowcast (valid 14 to 16 UTC).

Fig. 2: E-View satellite Image at 1355 UTC Wed 2 July 2013, lightning detections within the last 5 minutes and SYNOP reports from 13 UTC.

Fig. 2: Nowcast display at 1355 UTC Wed 2 July 2013: Meteosat E-View satellite image, latest SYNOP reports (13 UTC) and lightning detections within the last 5 minutes.

It was decided to cover the already existing Czech storms (plus expected further initiations) with a watch area for a heavy rain risk. A last moment hail watch was added for the forming storms over SW Poland, after the 12 UTC Wroclaw sounding had arrived just in time. This sounding showed 800 J/kg CAPE with a surface temperature of 28°C and a surface dew point of 14°C (Fig. 3), while measured dew points up to 18°C in the near surroundings suggested even higher CAPE values.

Fig. 3: 12 UTC Wed 3 July 2013 sounding from Wroclaw (PL).

Fig. 3: 12 UTC Wed 3 July 2013 sounding from Wroclaw (PL).

Given the forecasted lack of too interesting weather, a closer look at the successive verification of day 3, day 2, day 1 forecasts and nowcasts will likely be given in tomorrow’s weather summary for today’s case. Teaser: a few severe weather reports have already arrived for the areas of interest.

Share

Tue 2 July 2013: better storm organization than expected over East-Central Europe

Did somebody’s lament (“That really sucks if it is July and the best storms can be found in Northern Africa!”) yesterday help? We don’t know. Anyway, the second day of the first Testbed week turned out to be more interesting than anticipated.

The verification, which opened up our daily program, revealed that yesterday (Mon 1 July 2013) evening and night quite a number of storms had popped up along the convergence line across Northern Germany and Poland mentioned in yesterday’s weather summary. A handful of marginally large hail (2 cm) and heavy rain events was reported with this activity, hence a level 1 area might have been the better choice along with the well predicted thunder areas (Fig.1). The mesocyclone detection algorithm, which is provided by the German Weather Service (DWD) and based on the German radar network, recognized at least weak rotation with almost every other of these storms. This suggests that a number of supercells was interspersed, which is rather surprising, considering a rather modest background of environmental conditions (CAPE likely below 500 J/kg, 0-6 km vertical wind shear not above 15 m/s).

Fig.1:  Verification of the day 1 forecast for Mon 1 July 2013. Magenta dots: lightning detections (EUCLID), green triangles: large hail reports (ESWD).

Fig.1: Verification of the day 1 forecast for Mon 1 July 2013. Magenta dots: lightning detections (VAISALA GLD360), green triangles: large hail reports (ESWD).

The same boundary and an accompanying short-wave trough were again the main focus for thunderstorms today on their further way to the E and SE, embedded in an equally modest-looking setup of limited CAPE and shear. After the team for day 1 forecast (for today, Tue 2 July 2013) had largely confirmed Monday’s day 2 forecast with two low-end level 1 areas for large hail in parts of Poland and Central France, from noon onward scattered thunderstorms formed over Poland, E Germany, the Czech Republic and E Austria. These storms soon became very interesting for the nowcasting activities during the afternoon (Munich domain). Two handfuls of reports of 2-3 cm sized hail appeared in the ESWD in the following hours, along with a few additional reports of heavy rain, of which, however, at the time of writing it is still unclear if they indeed match our criteria (substantial damage inflicted). This hail and rain risk was correctly seen by the nowcasters, while some individual events remained elusive enough to occur outside of the drawn watch areas. As an example, Fig. 2 shows the 13 UTC nowcast (valid from 13 to 15 UTC), which correctly captured two hail events in Poland, closely missed a hail and a rain event in the Czech Republic and missed an isolated hail event in Austria. The latter was associated with a strong multicell storm which also caught our eyes at the Testbed site in Wiener Neustadt, but it stuck to the Alpine rim with continuous backbuilding and failed to descend into the forelands.

Fig. 2: Verification of the nowcast issued at 13 UTC Tue 2 July 2013, valid for the 13 to 15 UTC period. Red line: watch area for a hail (“H”) and heavy rain (“R”) risk; magenta dots: lightning detections (VAISALA GLD360); green triangles and blue dots: large hail and heavy rain reports (ESWD), respectively.

In general, the aptitude of today’s convection to produce (at least marginally) large hail was perceived higher than a priori expected. We also noted that the strongest storms conspicuously formed beneath a pronounced pink band in the “air mass” satellite product, which illustrated a streamer of very dry air in the upper troposphere, a so-called dry intrusion (Fig. 3), which accompanied and illustrated the sharp upper-level trough.

Fig. 3: RGB air mass satellite product at 1300 UTC Tue 2 July 2013 plus lightning detections.

Fig. 3: Meteosat RGB air mass satellite product at 1300 UTC Tue 2 July 2013 plus lightning detections within the last 15 minutes.

We assumed that large-scale lift of the whole column of air ahead of this trough managed to steepen the vertical temperature gradient across the lower and middle troposphere, as it was quite impressively shown by the 12 UTC soundings across the region – from North to South: Lindenberg (DE), Wroclaw (PL), Prague (CZ), Kuemmersbruck (DE), Munich (DE) and Vienna (AT) -, all of which exhibited a few hundred J/kg of CAPE (Fig. 4).

Fig. 4a.

Fig. 4b.

Fig. 4c.

Fig. 4d.

Fig. 4e.

Fig. 4f.

This is in line with preliminary climatological studies with ESWD data, which suggest that CAPE mainly based on steep lapse rates is more conducive to hail formation than CAPE mainly based on rich low-level moisture. The latter would rather feature an enhanced heavy rain risk instead. An additional reason for today’s fairly large number of hail reports may have been stronger than forecasted deep-layer shear in the range of the short-wave trough, which would match our subjective impression of a sharper trough.

Tomorrow (Wed 3 July), another interesting day is in store for the Munich domain with the arrival of a weak cold front and another short-wave trough from the West, as it can be seen in the day 2 forecast issued by the other team (Fig. 5).

Fig. 5: Day 2 forecast for Wed 3 July 2013. Thin yellow line: >15% thunder probability; thick yellow line: >50% thunder probability>; orange line: 5-15% probability of severe weather, all relating to a 40 km radius around a given point.

Fig. 5: Day 2 forecast for Wed 3 July 2013. Thin yellow line: >15% thunder probability; thick yellow line: >50% thunder probability; orange line: 5-15% probability of severe weather, all relating to a 40 km radius around a given point.

—–

Day 2 Forecast

Valid: Wed 03 Jul 2013 06:00 to Thu 04 Jul 2013 06:00 UTC

Issued: Tue 02 Jul 2013 08:33

Forecaster: ESSL TESTBED

Prefrontal of a coldfront which is moving eastwards slow moving thunderstorms will develop during the day and will only organize  locally due to modest CAPE values and small vertical wind shear under 15m/s.

A level 1 warning is issued for northern austria, czech republic and western poland mainly for heavy rainfall and to a lesser extent for large hail  which will rather develop in the eastern part of the level 1 area.

—–

Side note: the German COSMO shows the most “aggressive” solution and forecasts plentiful convective precipitation (> 50 mm) even over Wiener Neustadt tomorrow evening and in the first night hours, whereas the other models are more reluctant and keep the precipitation maximum a bit further to the West. Stay tuned!

Share

Mon 1 July 2013: a cold start into a difficult day

Phew! The atmosphere did not know any mercy and confronted the participants of the first Testbed week 2013 with a challenging start: no obvious hot spot for severe storms anywhere, but a lot of areas with an enhanced thunderstorm risk and marginal severe weather chances scattered across the continent.

After the day 1 forecast group (i.e., the forecasters for the present day, Mon 1 July 2013) could not decide whether to focus on the Helsinki or Paris domain, they ended up with choosing the Warsaw domain instead. This turned out to be a good solution, as it almost fully covered the area where most evening and nighttime convection was expected.

The weather pattern was characterized by a Westerly upper-level flow with warm air advection across many parts of Europe, in which the forecast models agreed on increasing low-level moisture and the evolution of a little CAPE (400-800 J/kg) in the afternoon and evening hours over Northern France, Belgium, the Northern half of Germany and Western Poland. Various sources of lift were soon identified: warm air advection and – later towards evening – the arrival of a quite pronounced short-wave trough would provide synoptic-scale lift. Closer to the surface, a wind shift line moved in from the Northwest, probably originating from an old cold front. Consequently, a >50% thunder probability area was issued for the Northern half of Germany and Western Poland. A >15% thunder probability area was additionally drawn over the Alps for isolated air mass thunderstorms. Severe weather was considered unlikely: vertical wind shear would only start to increase in the night, when no surface-based convection was expected any more which could fully benefit from it.

The 12 UTC soundings tempered the mood for a short time, as most of the Central European sites still featured a cap at ~850 hPa which would likely suppress convection. However, the soundings along the wind shift line – Trappes (France), Meiningen and Lindenberg (Germany) – already showed a litte instability which was almost uncapped. Indeed a band of growing cumulus clouds with first radar echoes and lightning strikes soon developed and showed the importance of the concentrated lift associated with this convergence line (Fig. 1).

Fig. 1: E-view satellite image at 15 UTC Mon 1 July 2013 with overlaid surface observations.

Fig. 1: Nowcast display at 1500 UTC Mon 1 July 2013: Meteosat E-view satellite image and SYNOP observations.

As this convection was still too modest to be interesting for the nowcasting session in the afternoon, the attention shifted to another area with thunderstorm activity in Northern Finland. Due to limited CAPE, weak vertical wind shear and some obstructive-looking cloudiness, this convection was initially considered unlikely to produce severe weather. However, after 14 UTC several storms connected to a line which moved Northwestward and tempted the forecasters to issue a watch area for severe wind gusts in their first nowcast (issued at 1430 UTC, valid for the 1430 to 1630 UTC period). This decision was not so much fostered by the conviction that indeed something severe would happen, but at least to an equal part by the desire to try the nowcasting tool. No watch area was drawn in the second nowcast (1530 to 1730 UTC) any more, as the convective line was already moving out of the Helsinki domain and the functionality of the nowcasting tool was successfully proven.

Meanwhile, the other group labored over the day 2 forecast (Tue 2 July 2013). They chose the Munich domain, where an increasing coverage of thunderstorms in the warm air mass was foreseen, and they even found two small areas where they could issue a level 1 mainly for a hail risk (Fig. 2):

Fig. 2: day 2 forecast valid for the period 06 UTC Tue 2 July 2013 to 06 UTC Wed 3 July 2013.

Fig. 2: day 2 forecast valid for Tue 2 July 2013. Thin yellow line: >15% thunder probability; thick yellow line: >50% thunder probability; orange line: low probability (5-15%) of severe weather, all relating to a radius of 40 km around a given point.


Day 2 Forecast

Valid: Tue 02 Jul 2013 06:00 to Wed 03 Jul 2013 06:00 UTC

Issued: Mon 01 Jul 2013 13:28

Forecaster: ESSL TESTBED

A level 1 was issued for NW Poland for large hail and to a lesser extent for excessive precipitation.

A level 1 was issued for south-central France for large hail.

Ahead of an strong mid/upper trough moving eastward from Germany towrds the northeast during the forecast period, moderately steep lapse rates and adequate moisture will aid to produce~500-1000 J/kg of CAPE. In combination with deep-layer wind shear of about 15 m/s, this provides the setting for a number of thunderstorm, some of which may produce 2-4 cm large hail across NW Poland. Almost front parallel storm motion may lead to some local excessive precipiation.

Across south-central France some 1000 – 1500 J/kg of CAPE may prove adequate for isolated large hail with storms developing across the Massif Central.


For the day 3 forecast (Wed 3 July 2013), the same group then identified a region with a low-end severe weather risk from Poland to the Eastern Alpine region. Day 4 (Thu 4 July 2013) and day 5 (Fri 5 July 2013) were finally declared unpredictable due to the huge model discrepancies. However, it was anticipated that the chances for better organized thunderstorms and severe weather would remain low due to the weak dynamics across most of the continent.

Of course we hope that the forecast models can better agree on a common scenario tomorrow (Tuesday). Conclusion after the first day of Testbed 2013: good spirit and an uncooperative atmosphere!

Share

The first day at the ESSL Testbed

Vivid discussions are going on in the so-called “map room” (because there is a 3D-map on one of the walls):

088

And also the forecasting team in the so-called “green room” (there are plants!) is actively discussing the “Day 1 Forecast”:

101

In the first week participants from 10 different countries are on site (Turkey, Poland, Estonia, Austria, Germany, Czech Republic, Bosnia Herzegovina, Slovakia, Slovenia and Holland).

Share

Testbed 2013 ready to begin

The last preparations have now been made and we are ready to start with this year’s ESSL Testbed. ESSL is looking forward to welcoming around 50 participants from 20 countries in the coming 4 four weeks in ESSL’s Research and Training Centre in Wiener Neustadt, Austria.

In this year’s edition of the Testbed, we will evaluate 6 forecast-supporting tools, and provide training to forecasters.  New features of this year’s Testbed are this Testbed Blog and remote access to the Testbed Data Interface for participants.

Like last year, with support of EUMETCAL, participants will be able to attend the Testbed’s Weather Briefings and Expert Presentations in the weeks that they are not at the Centre.

small_testbed_team

The ESSL team welcomes this year’s Testbed participants.


Share