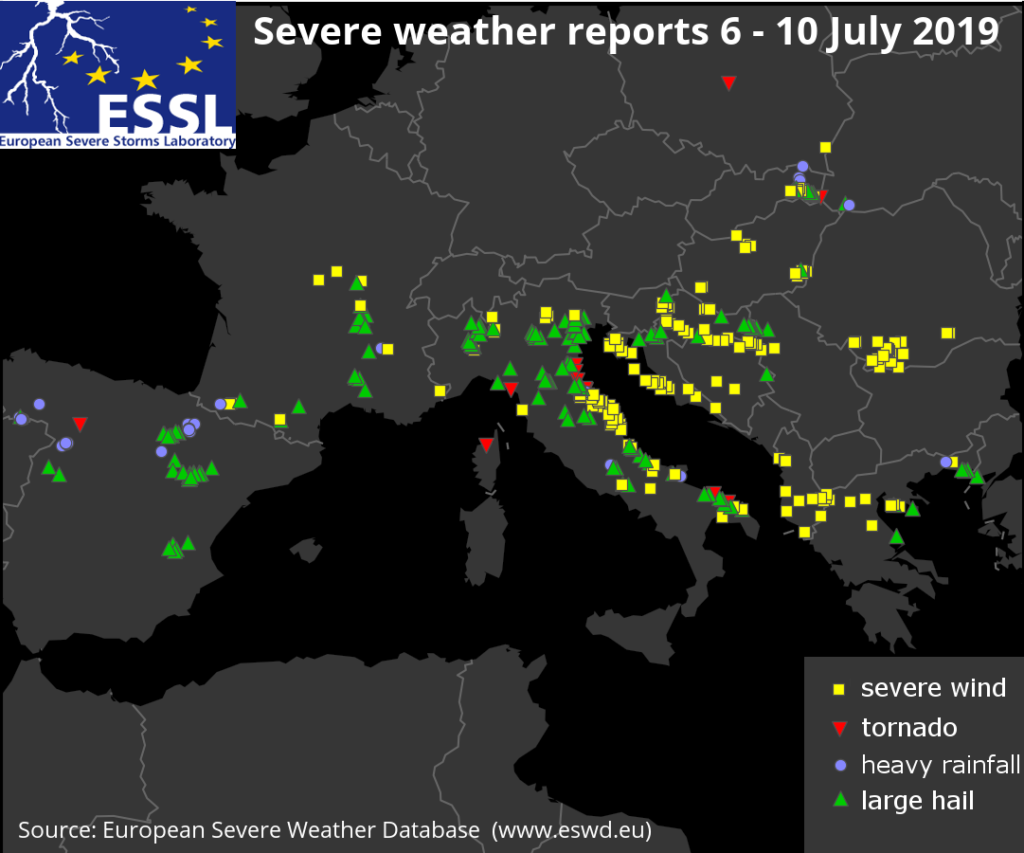
In the recent days, parts of western and southern Europe have experienced an extraordinary outbreak of severe weather. Between 6 and 10 July 2019, 480 reports were submitted to the European Severe Weather Database (www.eswd.eu). The severe weather included flash floods, large hail, tornadoes, and damaging wind gusts.
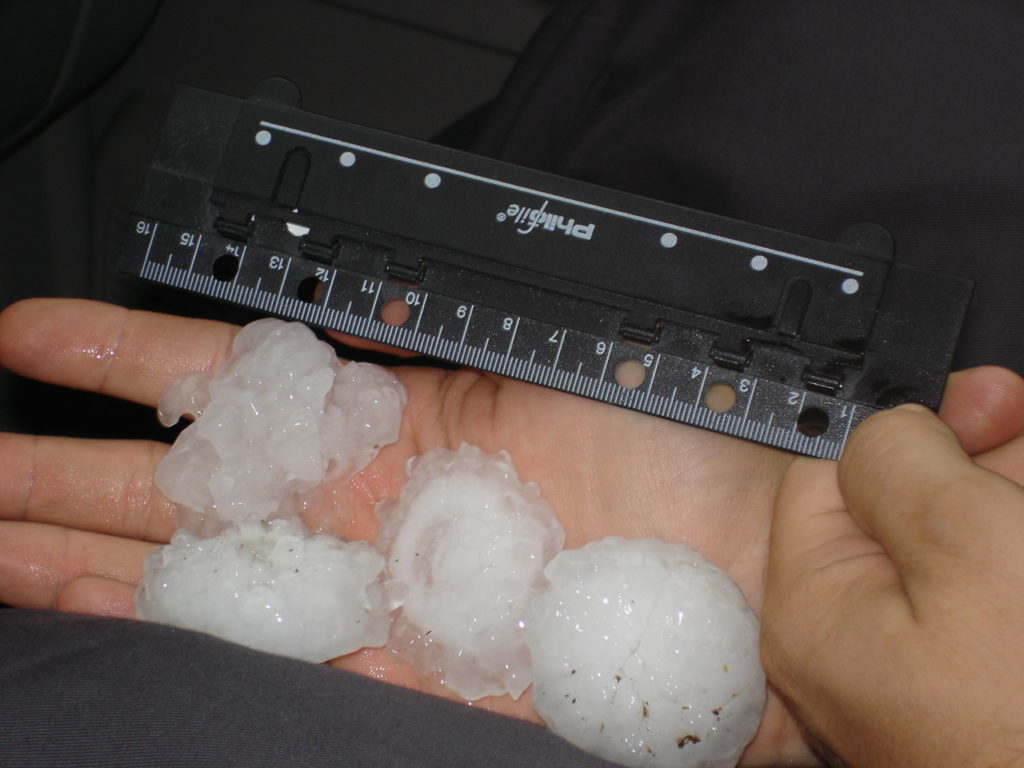
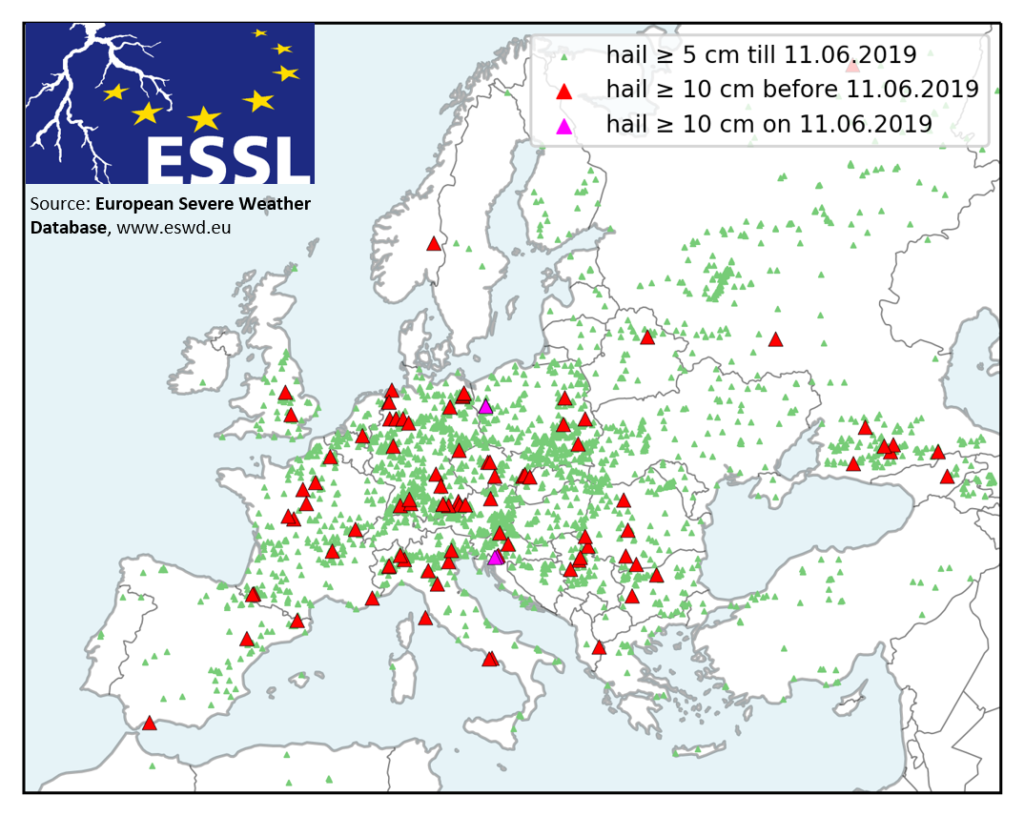
During this period, the largest reported hailstones fell on 10 July in Pescara, Italy, and were estimated at 14 cm in diameter. This almost ties the previous record hailstone size in the database, 15 cm, observed on 20 June 2016 in Timișoara, Romania.
The storms had large societal impacts with 10 fatalities (6 in Greece) and 90 injuries (48 in Greece alone, but some media mention that up to 100 people have been injured), mostly from damaging wind gusts and hail. Most fatalities and injuries were reported on 10 July in northern Greece, following a convective windstorm that hit Chalkidiki. The highest number of severe weather reports originated from Italy, where more than 150 reports were collected during the 5 subsequent days of this severe weather outbreak.
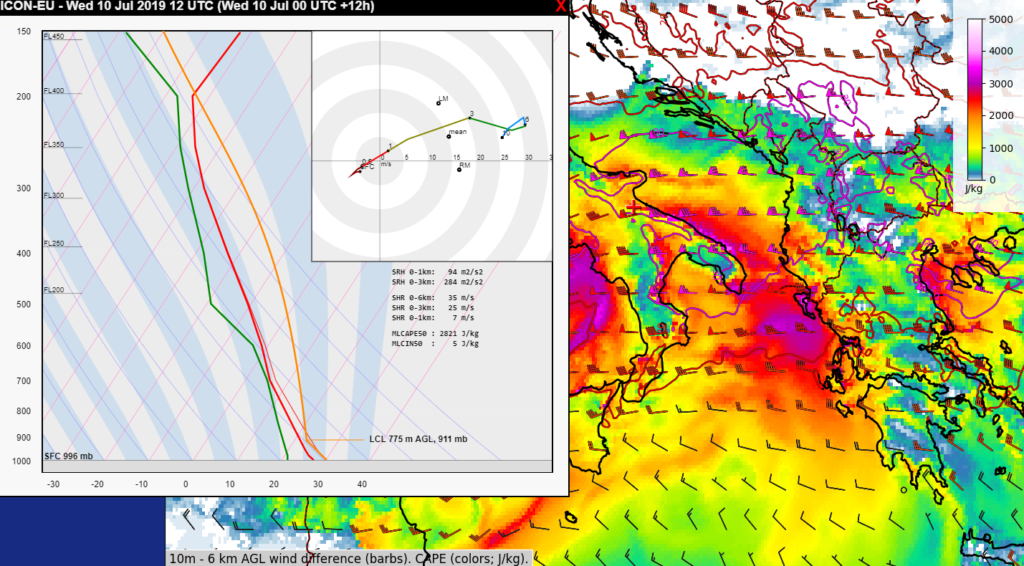
What caused such a long-lasting outbreak of severe convective storms that impacted areas like Northeastern Italy several times in a row? The reason was a stalling frontal zone over the Alpine range, which initiated storms in a very moist air-mass with high convective available potential energy (CAPE) that frequently exceeded 2000 J/kg. Such high CAPE values supported strong updrafts in forming convective storms. At the same time, strong winds in the mid and upper troposphere (between 3 and 10 km above the surface) south of the front, created strong vertical wind shear. The wind shear helped the storms to organize into supercells (storms with rotating updrafts) or intense squall lines and bow-echoes, which are known for the strong winds they can produce. The figure below shows that, high CAPE (colours) and strong vertical wind shear (wind barbs) were collocated over southern Italy and Greece on 10 July. The outbreak only ended as the frontal zone finally moved southeast, followed by drier and cooler air in its wake.
What happened on the individual days of the outbreak? On 6 July 2019 severe weather was reported from France and Italy. Over France, very large hail up to 8 cm in diameter and wind damage occurred. Over Italy, the regions of Friuli-Venezia Giulia, Veneto and Piemonte experienced very large hail. The area nea Vercelli was particularly hard hit with roofs completely destroyed by hail and cars heavily damaged with windows broken out. Severe wind gusts were reported from Switzerland.
7 July 2019 featured the most extensive area of severe weather that occurred in two belts: from southeastern Slovakia to Ukraine and from northeastern Italy towards Romania. Very large hail, up to 7 cm across, was reported from Croatia and a swath of severe wind gusts extended along the Adriatic Sea coastline and from Serbia to Romania. A 32 m/s wind gust was measured in western Romania in the evening hours and 30 m/s wind gust was measured in Zadar, Croatia overnight. Furthermore, a tornado was reported from Syurte, Ukraine, which occured with a long-lived supercell that also produced very large hail and downbursts over Slovakia.
On 8 July 2019, severe thunderstorms again impacted northeastern Italy with very large hail. However, arguably the most severe weather happened in Spain, where severe flash floods killed a person in the town of Morriones. Besides flash flooding, very large hail up to 8 cm, a F1 tornado and severe wind gusts were reported from the northern part of the country.
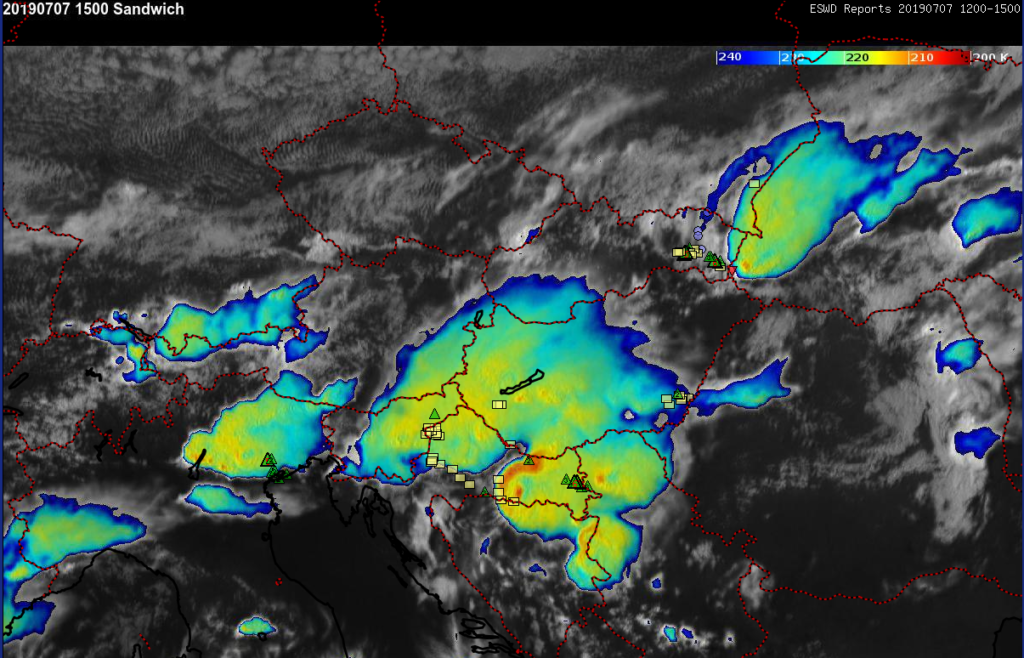
The axis of severe weather shifted more to the south on the following day, 9 July 2019. In the afternoon, isolated storms produced very large hail up to 8 cm in diameter over Italy. Later on, storms clustered into a large convective system and produced swaths of damaging wind gusts, which extended over the Adriatic Sea towards Croatia, Montenegro and Albania.
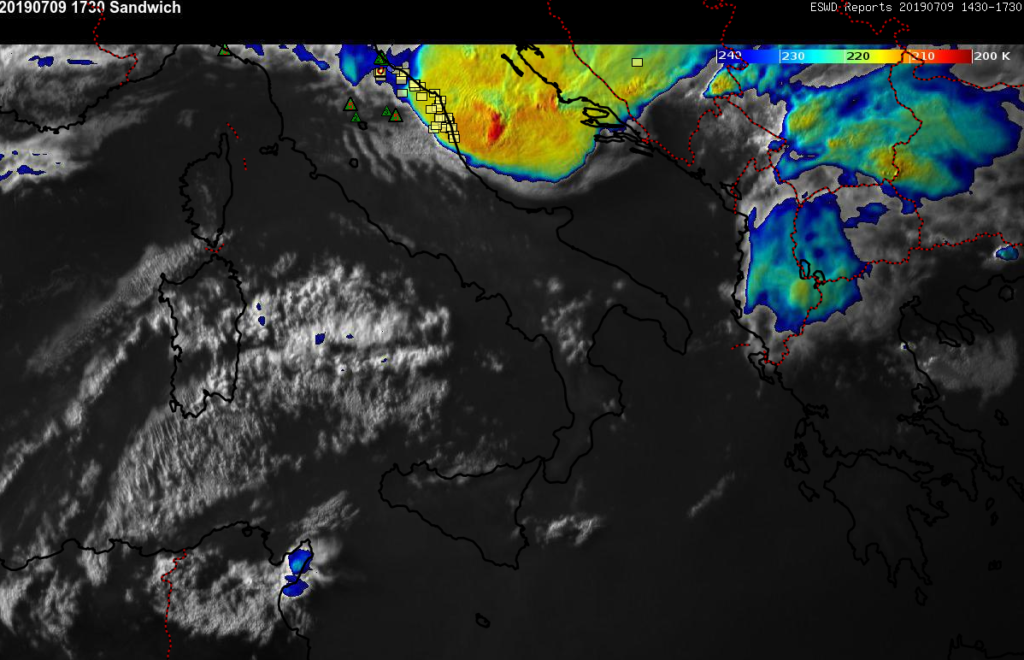
9 July 2019 17:30 UTC Meteosat-10 visible and infrared – BT enhanced satellite imagery combination (sandwich) with ESWD reports from the previous 3 hours. Green triangles represent large hail (number inside indicates the diameter), yellow squares severe wind gusts and red triangles tornadoes. Two pronounced above anvil cirrus plumes are visible atop large convective system over the Adriatic Sea. Data source: EUMETSAT, ESSL.
The most societally impactful severe weather happened on the last day of the outbreak, 10 July 2019. Day started with an F1 tornado that injured 3 in Milano Marritima, Italy. By the early afternoon, the storms moved south and intensified while producing giant hail, up to 14 cm diameter, injuring 20 people in the Abruzzo region of Italy. In the afternoon, Puglia was impacted by damaging hail and wind gusts.
Subsequently, several of the storms originating over Italy crossed the Adriatic Sea and impacted first Albania and then Greece. Numerous injuries were reported to have resulted from damaging wind gusts and hail. In the evening, the Chalkidiki peninsula was particularly hard hit with 6 fatalities. Some media sources are mentioning over 100 injuries. On the same day, 2 people were also killed by lightning in northwestern Turkey.
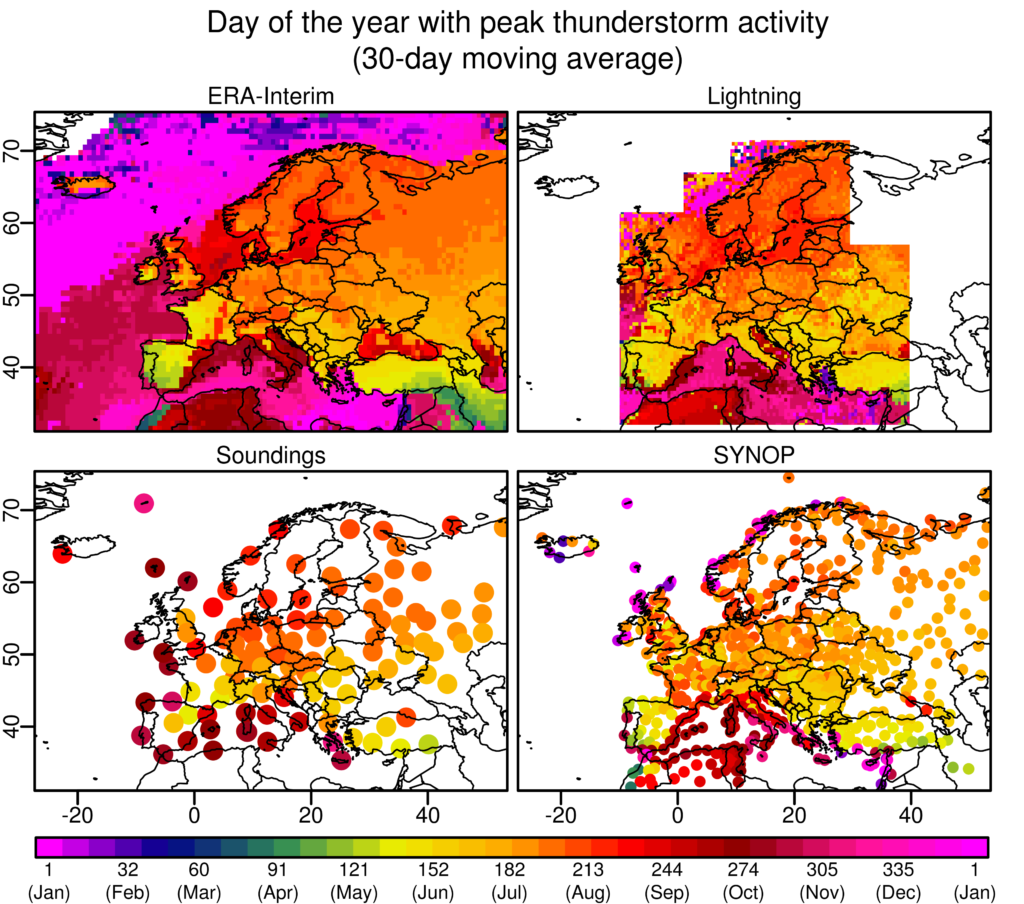
This outbreak was quite rare, but it is difficult to say how extraordinary it was, because the ESWD only since 2006 collects observations of large hail and local severe wind gusts, phenomena that often escape detection by traditional observation networks. Analyses of severe weather conditions are showing that severe weather conditions with high CAPE have become more frequent (read more here), and are likely to increase during the century (read more here).
For more information contact: Dr. Tomáš Púčik (tomas.pucik@essl.org)