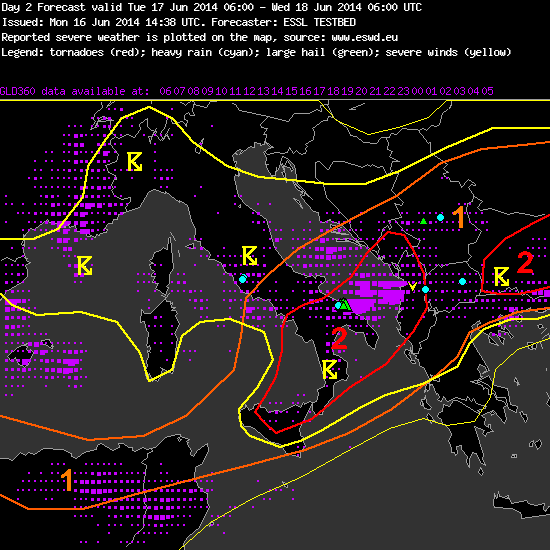
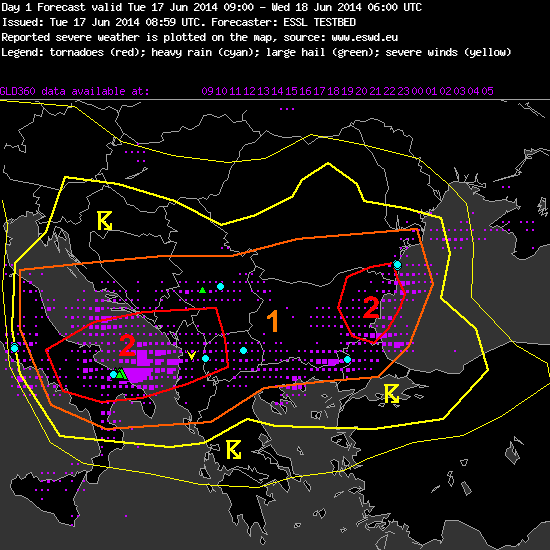
This week severe weather is likely to occur mainly in Italy and Balkan Peninsula. As usually, we began our day with Pieter’s verification of previous day1 and day2 forecasts. Quick look on them below:
In the afternoon, forecasts and nowcasts for Balkan Peninsula were presented by Meda Daniela Andrei from RNMA (Romania):

It is also worth to say few thoughts about overshooting top detection algorithm which is used by participants during ESSL Testbed. When thunderstorm’s updraft reaches equilibrium level (EL), usually its spreads horizontally and creates characteristic anvil. However, if the updraft is sufficiently strong it penetrates the EL and forms a convex feature so called overshooting top (OT). Since the satellite is able to measure cloud tops temperature, it can detect the OT by evaluating the temperature difference between the anvil and the penetrating updraft. Why is it useful in operational nowcasting? In general, it denotes places where the thunderstorm’s updraft core is located. Examples of OT detections during Testbed’s nowcast are shown below (squares with temperature difference values):
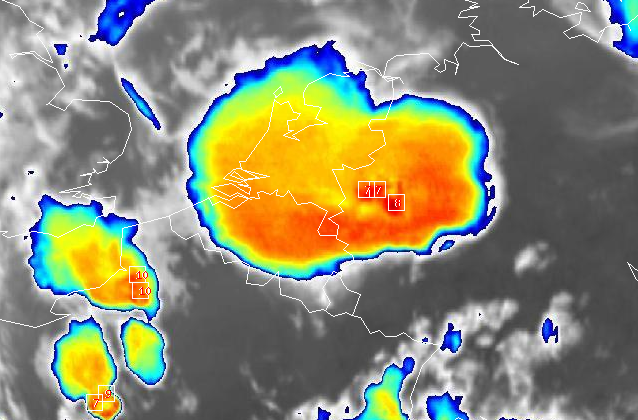
09.06.2014 1925 UTC Meteosat IR-108BT image + overshooting top detection algorithm. Detections denote quite well places with intense updrafts.
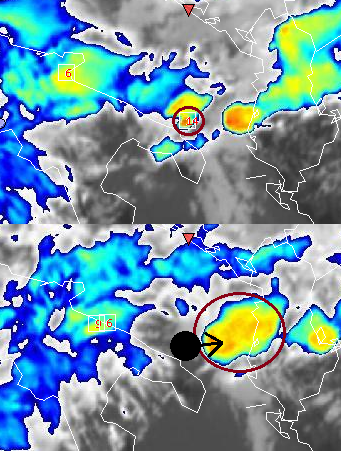
16.09.2014 1300 UTC (top) and 1430 UTC (bottom) Meteosat IR-108BT image + overshooting top detection algorithm. Detection of 14 C denotes a strong updraft of a developing thunderstorm. In the next 90 minutes thunderstorm became intense.
